Coinbase Premium Index: Tracking Institutional Demand
— By AliceOnChain in Crypto

Understand the mechanics of the Coinbase Premium Index. Learn how tracking the price gap between Coinbase and Binance reveals institutional capital flows and how to combine it with DEXTools features for advanced market insights.
Coinbase Premium Index: Tracking Institutional Demand
Market participants frequently search for reliable indicators to determine where large-scale capital is moving. In the crypto asset space, tracking the coinbase premium index has emerged as a premier on-chain method for distinguishing between retail-driven momentum and institutional accumulation. By learning to analyze this metric, traders can better understand Western institutional capital flows and accurately gauge shifting market structures.
What is the Coinbase Premium Index?
The institutional metric measures the percentage difference between the price of a major asset like Bitcoin on Coinbase Pro and its price on Binance.
Coinbase is widely recognized as the primary gateway for US-based institutional capital, corporate treasuries, and spot Exchange-Traded Funds (ETFs). Binance, conversely, serves a predominantly global, retail-heavy user base and dominates the international derivatives and spot markets.
The Mathematical Concept
The dataset calculates the price gap between the two platforms.
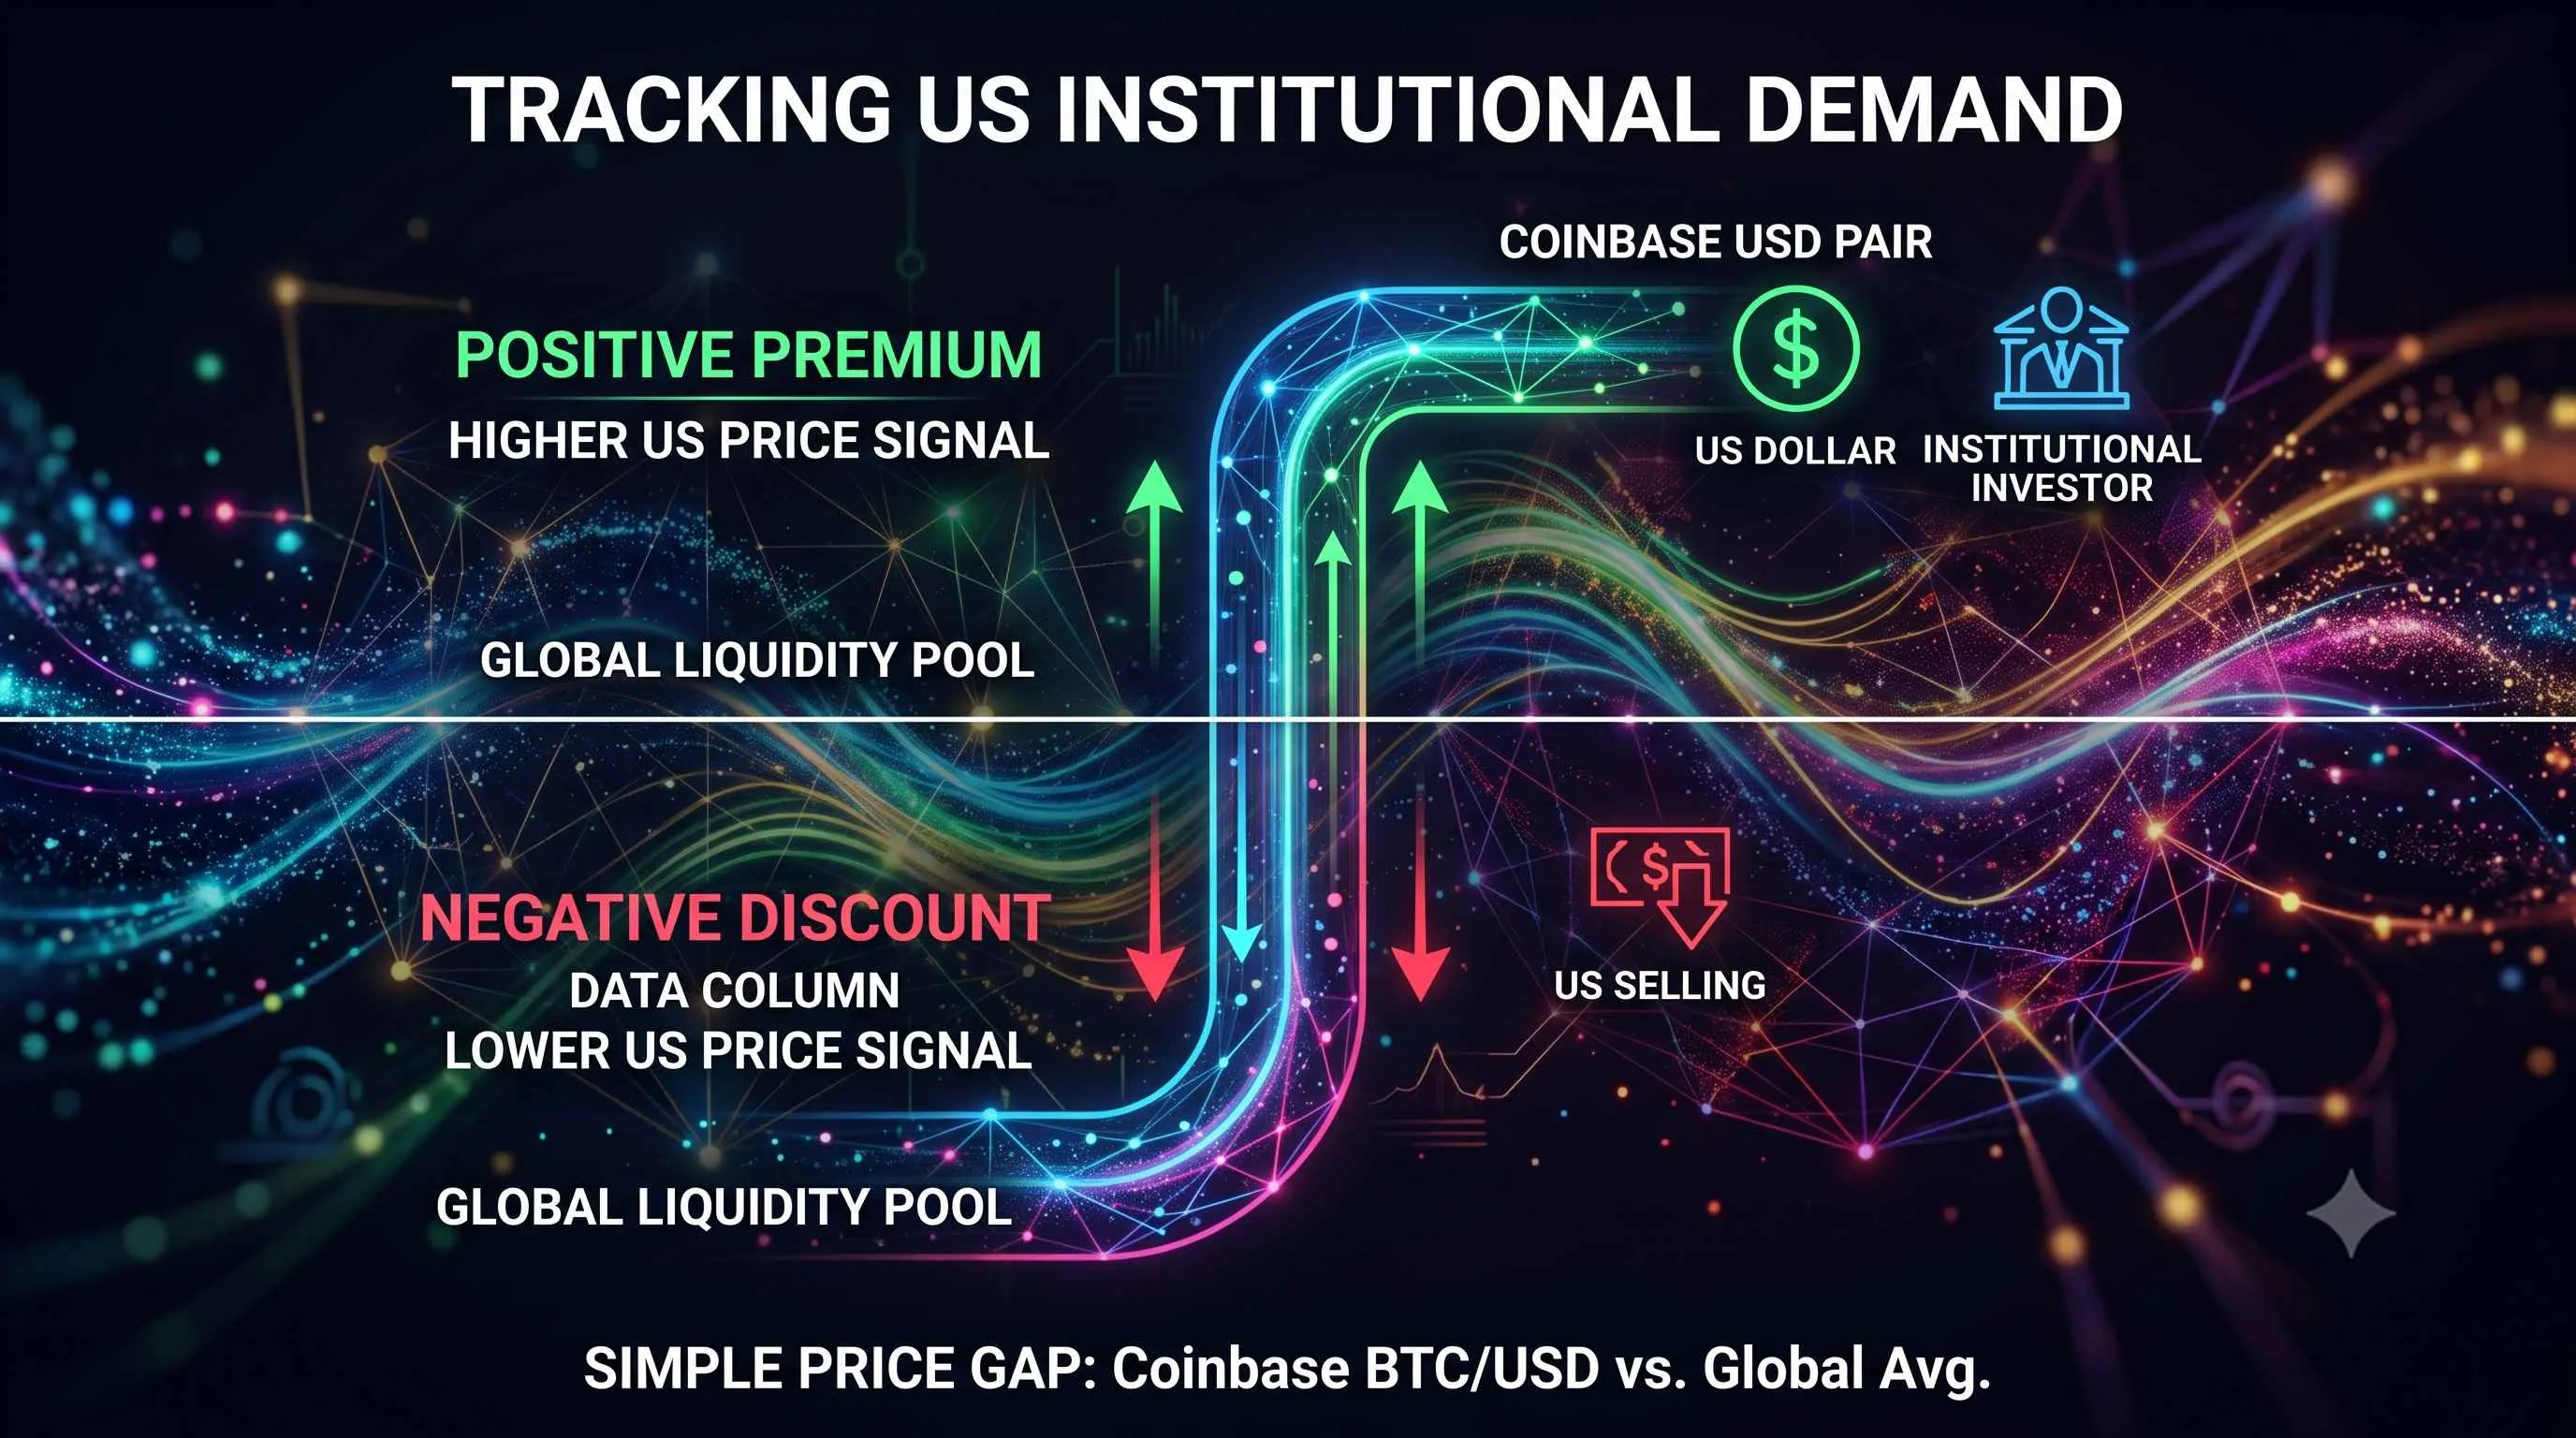
Positive Premium: When the asset price on the US exchange is higher than on Binance, it indicates strong buying pressure from US entities and institutional players.
Negative Premium (Discount): When the American price is lower than on Binance, it implies that US institutions are selling or that global retail demand is outpacing American capital allocation.
Because institutional orders are executed in size, they create temporary supply-demand imbalances on individual order books before arbitrageurs step in to close the gap across exchanges. These brief variations form the basis of the centralized premium.
Why Institutional Demand Alters Market Structure
Institutional market participants operate differently than retail traders. Instead of relying on sudden, volatile emotional market entries, large entities use algorithmic execution strategies like Time-Weighted Average Price (TWAP) to accumulate or distribute positions over days, weeks, or months.
When institutional demand rises, it often signals structural capital inflows that can sustain long-term trends. Conversely, retail-driven rallies may suffer from lower sustained liquidity, making them susceptible to sudden reversals.
Tracking these price dislocations helps traders understand whether a price movement has structural backing from deep-pocketed market players or if it is a highly leveraged, speculative retail move prone to sudden volatility liquidation events.
Interpreting Coinbase Premium Trends
Analysing this metric requires a probabilistic mindset. No single indicator functions perfectly in isolation, but recurring historical patterns offer valuable context.
Sustained Positive Premium during Uptrends
When an asset’s price climbs alongside a consistently positive reading, the trend may indicate healthy, spot-driven institutional accumulation. This behavior suggests that large buyers are willing to pay a slight premium to acquire spot assets, which historically serves as a foundational pillar for macro bull markets.
Negative Premium in Downtrends or Tops
A prolonged negative gap during a market correction often highlights steady institutional distribution or capital flight out of Western markets. Furthermore, if the price of an asset hits new highs while the premium turns sharply negative, it can signal a bearish divergence. This occurs because the retail market is pushing prices up on high leverage, while institutional players are actively selling into that liquidity.
Extremes and Market Capitulation
Massive negative spikes in the index occasionally coincide with macro market bottoms. During panic-selling events, forced liquidations can cause severe dislocations in institutional order books, driving the price spread deep into negative territory. Historically, when these dramatic drops stabilize, it may indicate that selling pressure has become exhausted.
Integrating Macro Sentiment with On-Chain DeFi Metrics
While tracking exchange pricing is highly effective for observing large centralized capital flows, crypto markets are interconnected. Institutional sentiment in centralized finance (CeFi) rapidly filters down into the decentralized finance (DeFi) ecosystem.
When institutional demand is high, capital eventually rotates into on-chain liquidity pools, yield protocols, and mid-cap decentralized assets. Savvy market participants utilize tools like DEXTools to catch these capital rotations early.
Utilizing DEXTools Charts and Pair Explorer
When you observe a prolonged positive spread, it is useful to monitor how that liquidity shifts into decentralized networks. By using the DEXTools Pair Explorer and tracking real-time DEXTools charts, you can monitor whether major network pairs are beginning to mirror that institutional momentum. Look for technical alignment, such as price breaking through major horizontal support or resistance levels on high decentralized trading volume.
Analyzing Volume and Liquidity Realities
Volume and liquidity are the bedrocks of sustainable market trends. A high valuation on the primary index means little to DeFi traders if on-chain pairs lack deep liquidity. Through DEXTools, you can analyze the total liquidity locked in a pool and evaluate the daily volume. If decentralized volume expands while macro institutional indicators are positive, it validates the strength of the broader market trend.
Managing Volatility and RSI Divergences
During periods of high institutional activity, volatility naturally increases. You can manage this volatility by overlaying momentum indicators like the Relative Strength Index (RSI) onto charts. If the centralized metric is rising but the on-chain RSI displays a bearish divergence (making lower highs while price makes higher highs), it suggests that local retail distribution is occurring on decentralized exchanges, advising caution.
Advanced On-Chain Verification: Whale Activity and Distribution
To confirm the narrative presented by the coinbase premium index, analysts often look directly at blockchain ledger data to track large wallet movements and holder distribution.
Holder Analysis and Bubblemaps
If the macro data indicates institutional buying, you should ideally see a corresponding consolidation of tokens into larger on-chain addresses. DEXTools provides a native Holder Analysis feature alongside integration with Bubblemaps. This allows you to visually map out token allocations.
If a project's holder distribution shows a cluster of interconnected whale wallets accumulating assets during a positive premium period, it strengthens the thesis of smart money positioning. If tokens are instead flowing into thousands of small, disconnected retail wallets, the trend may lack structural stability.
Monitoring Top Traders and Whale Activity
Tracking the Top Traders section on DEXTools can reveal whether profitable, high-net-worth addresses are buying or selling during centralized market dislocations. If a deep negative drop in the spread suggests institutional panic, but top-performing on-chain addresses are aggressively buying the dip in decentralized protocols, it highlights a potential divergence in sentiment that experienced traders look to exploit.
Step-by-Step Framework for Analyzing Market Sentiment
To implement these concepts into your regular research routine, consider the following sequential framework:
Step 1: Identify Macro Direction
Check a reliable on-chain data provider to look at the moving average of the spread. Determine whether the premium is primarily positive, negative, or flat over a multi-week period to establish the institutional backdrop.
Step 2: Corroborate with Centralized Volume
Verify if the price difference is backed by substantial spot trading volume on Coinbase. A high premium on low volume is less significant than a moderate premium sustained on massive trading volume.
Step 3: Scan DeFi Rotations via DEXTools
Open the DEXTools platform to scan trending pairs and high-volume pools. Look for sectors (such as Layer 1 assets, major DeFi protocols, or stablecoin pairs) that are attracting fresh capital during periods of high institutional confidence.
Step 4: Set Price Alerts and Risk Boundaries
Volatility can shift instantly. Utilize DEXTools Price Alerts to monitor critical support and resistance levels on your on-chain assets. Ensure your risk management parameters are firmly established before entering positions based on macro indicators.
Conclusion and Risk Management
The coinbase premium index is an indispensable asset for understanding the footprints of Western institutional capital. However, using it successfully requires an understanding that market dynamics are fluid. Indicators provide probabilistic edges, not absolute certainties.
Relying entirely on a single metric can create blind spots. Institutional buy walls can vanish during systemic financial shocks, and arbitrageurs can alter index readings during network congestion events.
The most effective approach involves combining macro metrics with granular, real-time on-chain data. By leveraging DEXTools to analyze liquidity depth, volume authenticity, whale distribution, and real-time pair dynamics, you can form a comprehensive, risk-managed view of the market structure.