NVT Ratio: The Price-to-Earnings Ratio for Crypto
— By AliceOnChain in Crypto

Discover how the Network Value to Transactions (NVT) ratio serves as the crypto equivalent to the traditional P/E ratio. Learn to read on-chain utility, spot market divergences, and enhance your DeFi trading strategy using DEXTools.
SEO TITLE: NVT Ratio: The Price-to-Earnings Ratio for Crypto META DESCRIPTION: Master the NVT ratio in crypto valuation. Learn how to combine on-chain transaction volume with DEXTools data to identify market tops and bottoms. FOCUS KEYWORD: nvt ratio SECONDARY KEYWORDS: crypto P/E ratio, on-chain valuation, market cap to volume, bitcoin NVT, crypto fundamental analysis, token valuation metrics URL SLUG: nvt-ratio-crypto-valuation-guide TAGS: DeFi, On-Chain Analytics, Crypto Valuation, Technical Analysis, DEXTools Tutorials, Trading Strategies EXCERPT: Discover how the Network Value to Transactions (NVT) ratio serves as the crypto equivalent to the traditional P/E ratio. Learn to read on-chain utility, spot market divergences, and enhance your DeFi trading strategy using DEXTools.
NVT Ratio Explained: The Price-to-Earnings Equivalent for Crypto
Evaluating digital assets requires a fundamental shift from traditional equity analysis. In traditional finance, investors rely heavily on the Price-to-Earnings (P/E) ratio to determine if a stock is overvalued or undervalued relative to its generated net income. However, decentralized networks do not operate like corporations. They do not report quarterly earnings, and their primary value stems from utility, security, and transaction throughput.
To bridge this analytical gap, on-chain analysts rely on the Network Value to Transactions metric. Often described as the crypto equivalent of the P/E ratio, this model measures the relationship between a blockchain’s market capitalization and its on-chain transaction volume. Understanding this calculation allows market participants to evaluate whether a token's price action is supported by actual network utility or driven by speculative volatility.
What is the Network Value to Transactions Metric?
Introduced by on-chain researcher Willy Woo, this fundamental metric is used to gauge the relative value of a cryptocurrency network. The core premise is simple: the economic value flowing through a blockchain should theoretically correlate with its overall market valuation.
The Logic Behind the Metric
Instead of relying on corporate revenue, the equation divides the total market capitalization of a specific token by its daily on-chain transaction volume. Both figures are measured in USD to ensure consistency across shifting market environments.
Market Capitalization: The total USD value of the circulating supply of a specific token.
Daily On-Chain Transaction Volume: The aggregate USD value of all transactions processed directly on the blockchain layer within a 24-hour period.
When evaluating assets on DEXTools, it is critical to distinguish between on-chain transaction volume (tokens moving between wallets on the underlying blockchain) and centralized exchange trading volume. The calculation relies exclusively on organic network utilization—the actual transfer of value between users, smart contracts, and decentralized protocols.
How to Interpret High and Low Valuation Outputs
This valuation tool serves as a core indicator of market sentiment and network equilibrium. Because it reflects a proportional relationship, its fluctuations reveal when price movement outpaces network utility, or vice versa.
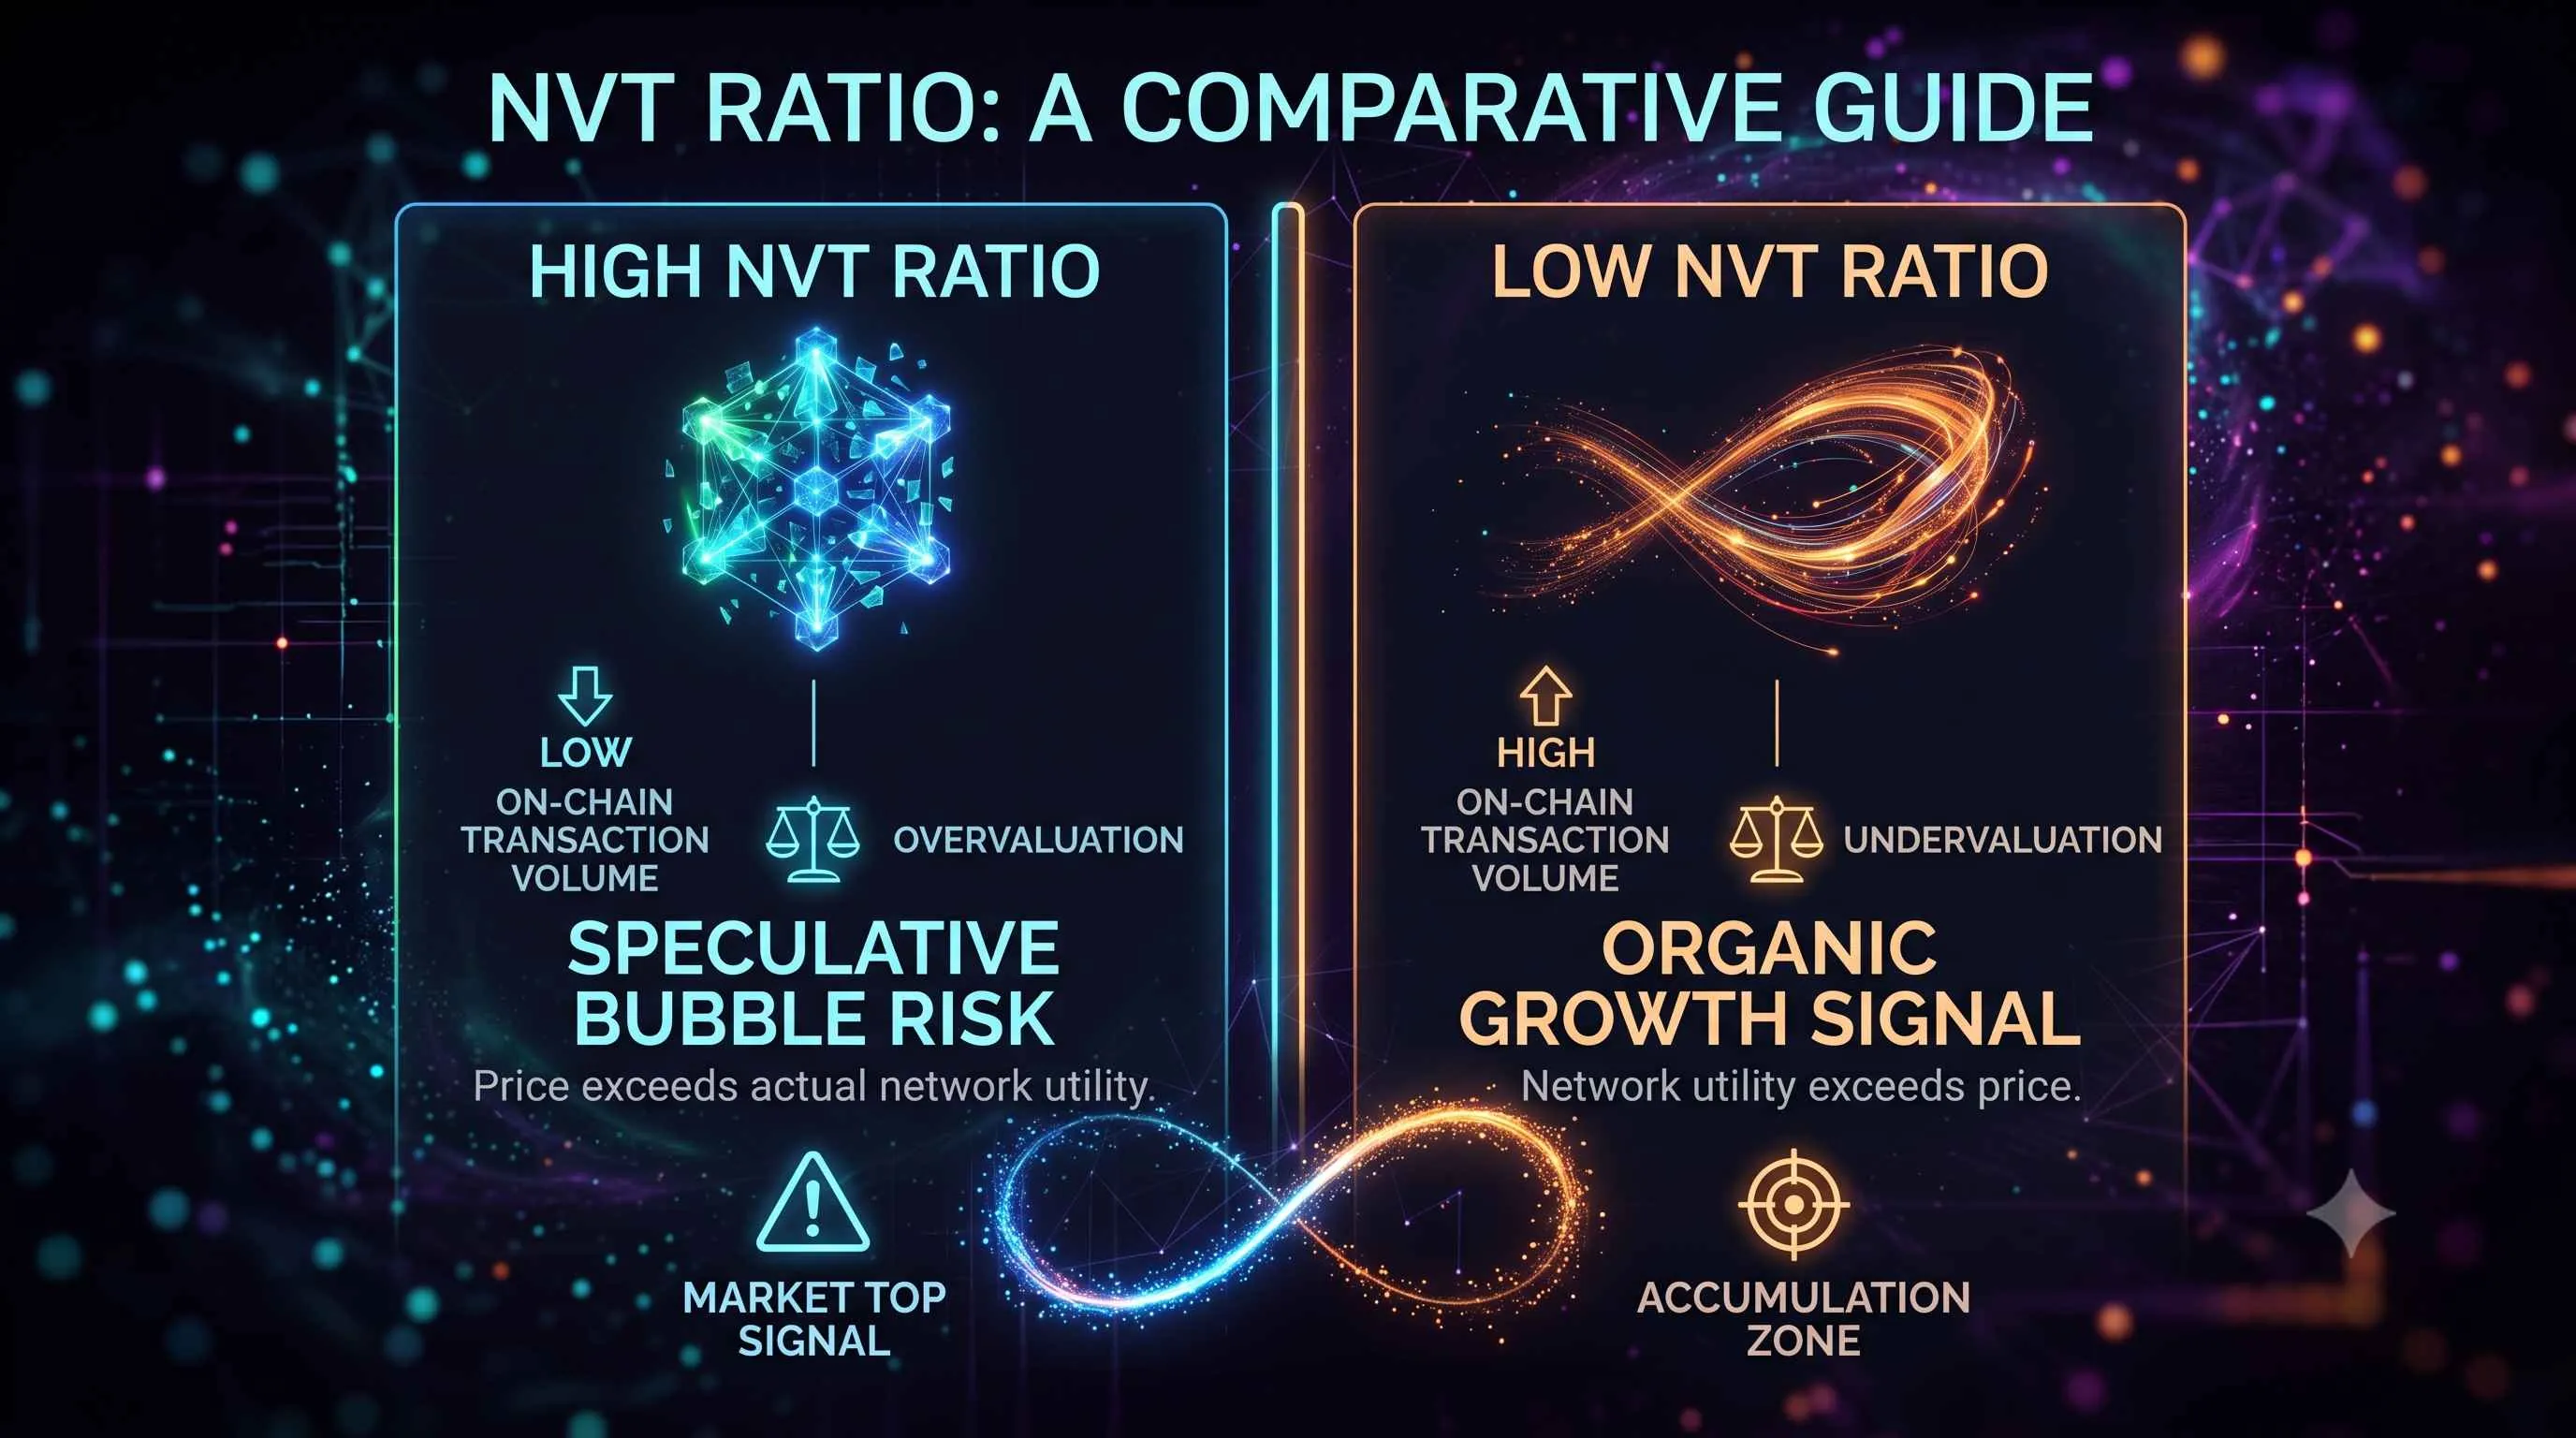
High Ratio Values: Speculative Premiums and Potential Tops
A high reading indicates that the network's market capitalization is growing significantly faster than its on-chain transaction volume. This scenario can signal two distinct market conditions:
Overvaluation/Speculative Bubbles: If the price rises exponentially while daily transaction volume remains stagnant or declines, the asset may be overvalued. The market is pricing in future expectations rather than current utility, which historically coincides with macro market tops or impending corrections.
High-Growth Phase: In younger networks, an elevated baseline may indicate a period of intense capital inflow where investors are accumulating tokens faster than the ecosystem can deploy operational dApps.
Low Ratio Values: Organic Growth and Potential Bottoms
Conversely, a low reading implies that the network's on-chain transaction volume is outperforming its market capitalization growth. This scenario typically suggests:
Undervaluation: The network is processing immense economic value relative to its current market price. This often indicates strong organic demand, sustainable utility, and a potential accumulation zone for long-term spot traders.
Bear Market Capitulation: During prolonged market downturns, speculative premium completely evaporates. If the price drops significantly but transaction volume remains steady due to stablecoin transfers or DeFi smart contract executions, the metric compresses, which can signal that a market bottom is forming.
Integrating On-Chain Analysis with DEXTools Features
While looking at network value relative to transactions provides an excellent macroeconomic view of an asset's fundamental health, integrating it with real-time liquidity and trading data on DEXTools creates a much more robust framework for risk management.
Correlating Volume and Price Action via Pair Explorer
When monitoring a specific pair using the DEXTools Pair Explorer, you can observe localized volume surges alongside price action. If your macro analysis shows a historically low valuation ratio, look for a stabilization of support lines on the DEXTools charts. A sudden spike in localized decentralized exchange (DEX) volume at a critical support level often serves as the practical execution trigger for an accumulation strategy.
Identifying Whale Activity and Holder Distribution
A common limitation of raw on-chain transaction volume figures is that they treat all network data equally. A massive transfer of tokens between a few institutional wallets can artificially distort the data, mimicking organic retail adoption.
To filter out this noise, smart money looks deeper into the Holder Analysis and Bubblemaps features on DEXTools. By cross-referencing a declining valuation ratio with decentralized distribution—meaning tokens are flowing from concentrated developer or whale wallets into a wider array of smaller retail addresses—traders can verify whether the network volume is genuinely decentralized or merely internal capital shuffling.
Managing Volatility with Price Alerts and Liquidity Tracking
Assets experiencing anomalous fundamental deviations often undergo periods of heightened volatility. As the price outpaces baseline utility, the risk of a sharp liquidation event increases. Traders can mitigate this risk by monitoring the Liquidity Tracking metric on DEXTools. If liquidity pools begin to thin out while valuations remain elevated, market depth may not support sudden selling pressure. Setting up DEXTools Price Alerts around key structural resistance points allows you to adjust exposure before volatility accelerates.
Advanced Applications: Divergences and Smooth Moving Averages
Raw daily valuation data can be highly volatile, creating market noise due to irregular network updates or institutional batch transfers. To turn the nvt ratio into an actionable strategy, analysts rely on smoothed variants and technical indicator crossovers.
The Smoothed Signal Variant
To create a more responsive indicator, analysts often modify the standard equation by using a 90-day moving average of the daily transaction volume instead of raw daily figures. This smoothing technique eliminates short-term anomalies and emphasizes the broader trend of network utility, making it easier to identify macro trend reversals.
Identifying RSI and Valuation Divergences
One of the most effective ways to spot structural shifts is by analyzing divergences between the network valuation trend, the Relative Strength Index (RSI), and the underlying price action.
Bearish Divergence: The token price creates higher highs on the chart, and the RSI shows strong momentum, but the valuation ratio is climbing aggressively to new peaks. This demonstrates that the upward price trend is completely unsupported by network utilization, signaling an unsustainable, momentum-driven rally.
Bullish Divergence: The asset price prints lower lows, breaking through historical support zones, while the core valuation metric forms a series of higher lows (compressing downward). This indicates that despite the panic selling reflected on the price chart, underlying economic usage is accelerating, signaling a strong probability of a reversal.
Nuances and Limitations in Modern DeFi
While tracking network value relative to transactions remains a foundational element of on-chain fundamental analysis, its application varies across different blockchain architectures. It cannot be applied universally without contextual adjustments.
The Impact of Layer-2 Scaling Solutions
In modern multi-chain ecosystems, looking exclusively at Layer-1 on-chain volume can yield a distorted view. As users migrate to Layer-2 (L2) rollups to save on gas fees, massive volumes of micro-transactions occur off the main chain. The L1 network may show a declining transaction volume (leading to an artificially high ratio), even though the overall ecosystem is thriving. Analysts must account for aggregate ecosystem volume across all execution environments when evaluating such assets.
Automated Market Makers (AMMs) and MEV Noise
The rise of decentralized exchanges and automated market makers has introduced significant noise into transaction data. Maximal Extractable Value (MEV) bots constantly execute high-frequency arbitrage loops. These automated transactions generate massive volume that does not necessarily reflect genuine retail or institutional adoption. Utilizing tools like DEXTools' Top Traders section can help you identify whether transaction spikes are driven by systematic bot activity or sustainable user interest.
Conclusion: Developing a Probabilistic Mindset
This classic ratio serves as a vital tool for evaluating asset sustainability, providing context to whether a project's market capitalization is anchored in utility or drifting on speculation. However, no single metric should ever be utilized in isolation. The most effective market strategies combine macroeconomic on-chain indicators with the real-time liquidity tracking, detailed holder charts, and precise volume metrics available on platforms like DEXTools. By focusing on confluence across multiple tools, market participants can better navigate the shifting dynamics of decentralized finance.