Stablecoin Supply Ratio (SSR) Explained: Crypto Buying Power
— By AliceOnChain in Crypto

The Stablecoin Supply Ratio (SSR) acts as a structural thermometer for crypto market liquidity. By understanding how the relationship between Bitcoin's market cap and stablecoin supply shifts, traders can better evaluate potential buying pressure and capital rotation.
Stablecoin Supply Ratio Explained: SSR and Crypto Buying Power
Understanding the underlying mechanics of capital flow is essential for navigating modern decentralized finance (DeFi) markets. To evaluate the aggregate purchasing power available in the market, institutional analysts and advanced retail traders frequently track the stablecoin supply ratio ssr as a core indicator of potential buying pressure. While technical analysis tools like moving averages and momentum oscillators offer insight into short-term price momentum, they often fail to capture these foundational liquidity dynamics driving the broader crypto ecosystem. An on-chain approach allows traders to look past pure price action and look directly at the asset reserves funding market movements.
What Is the Stablecoin Supply Ratio (SSR)?
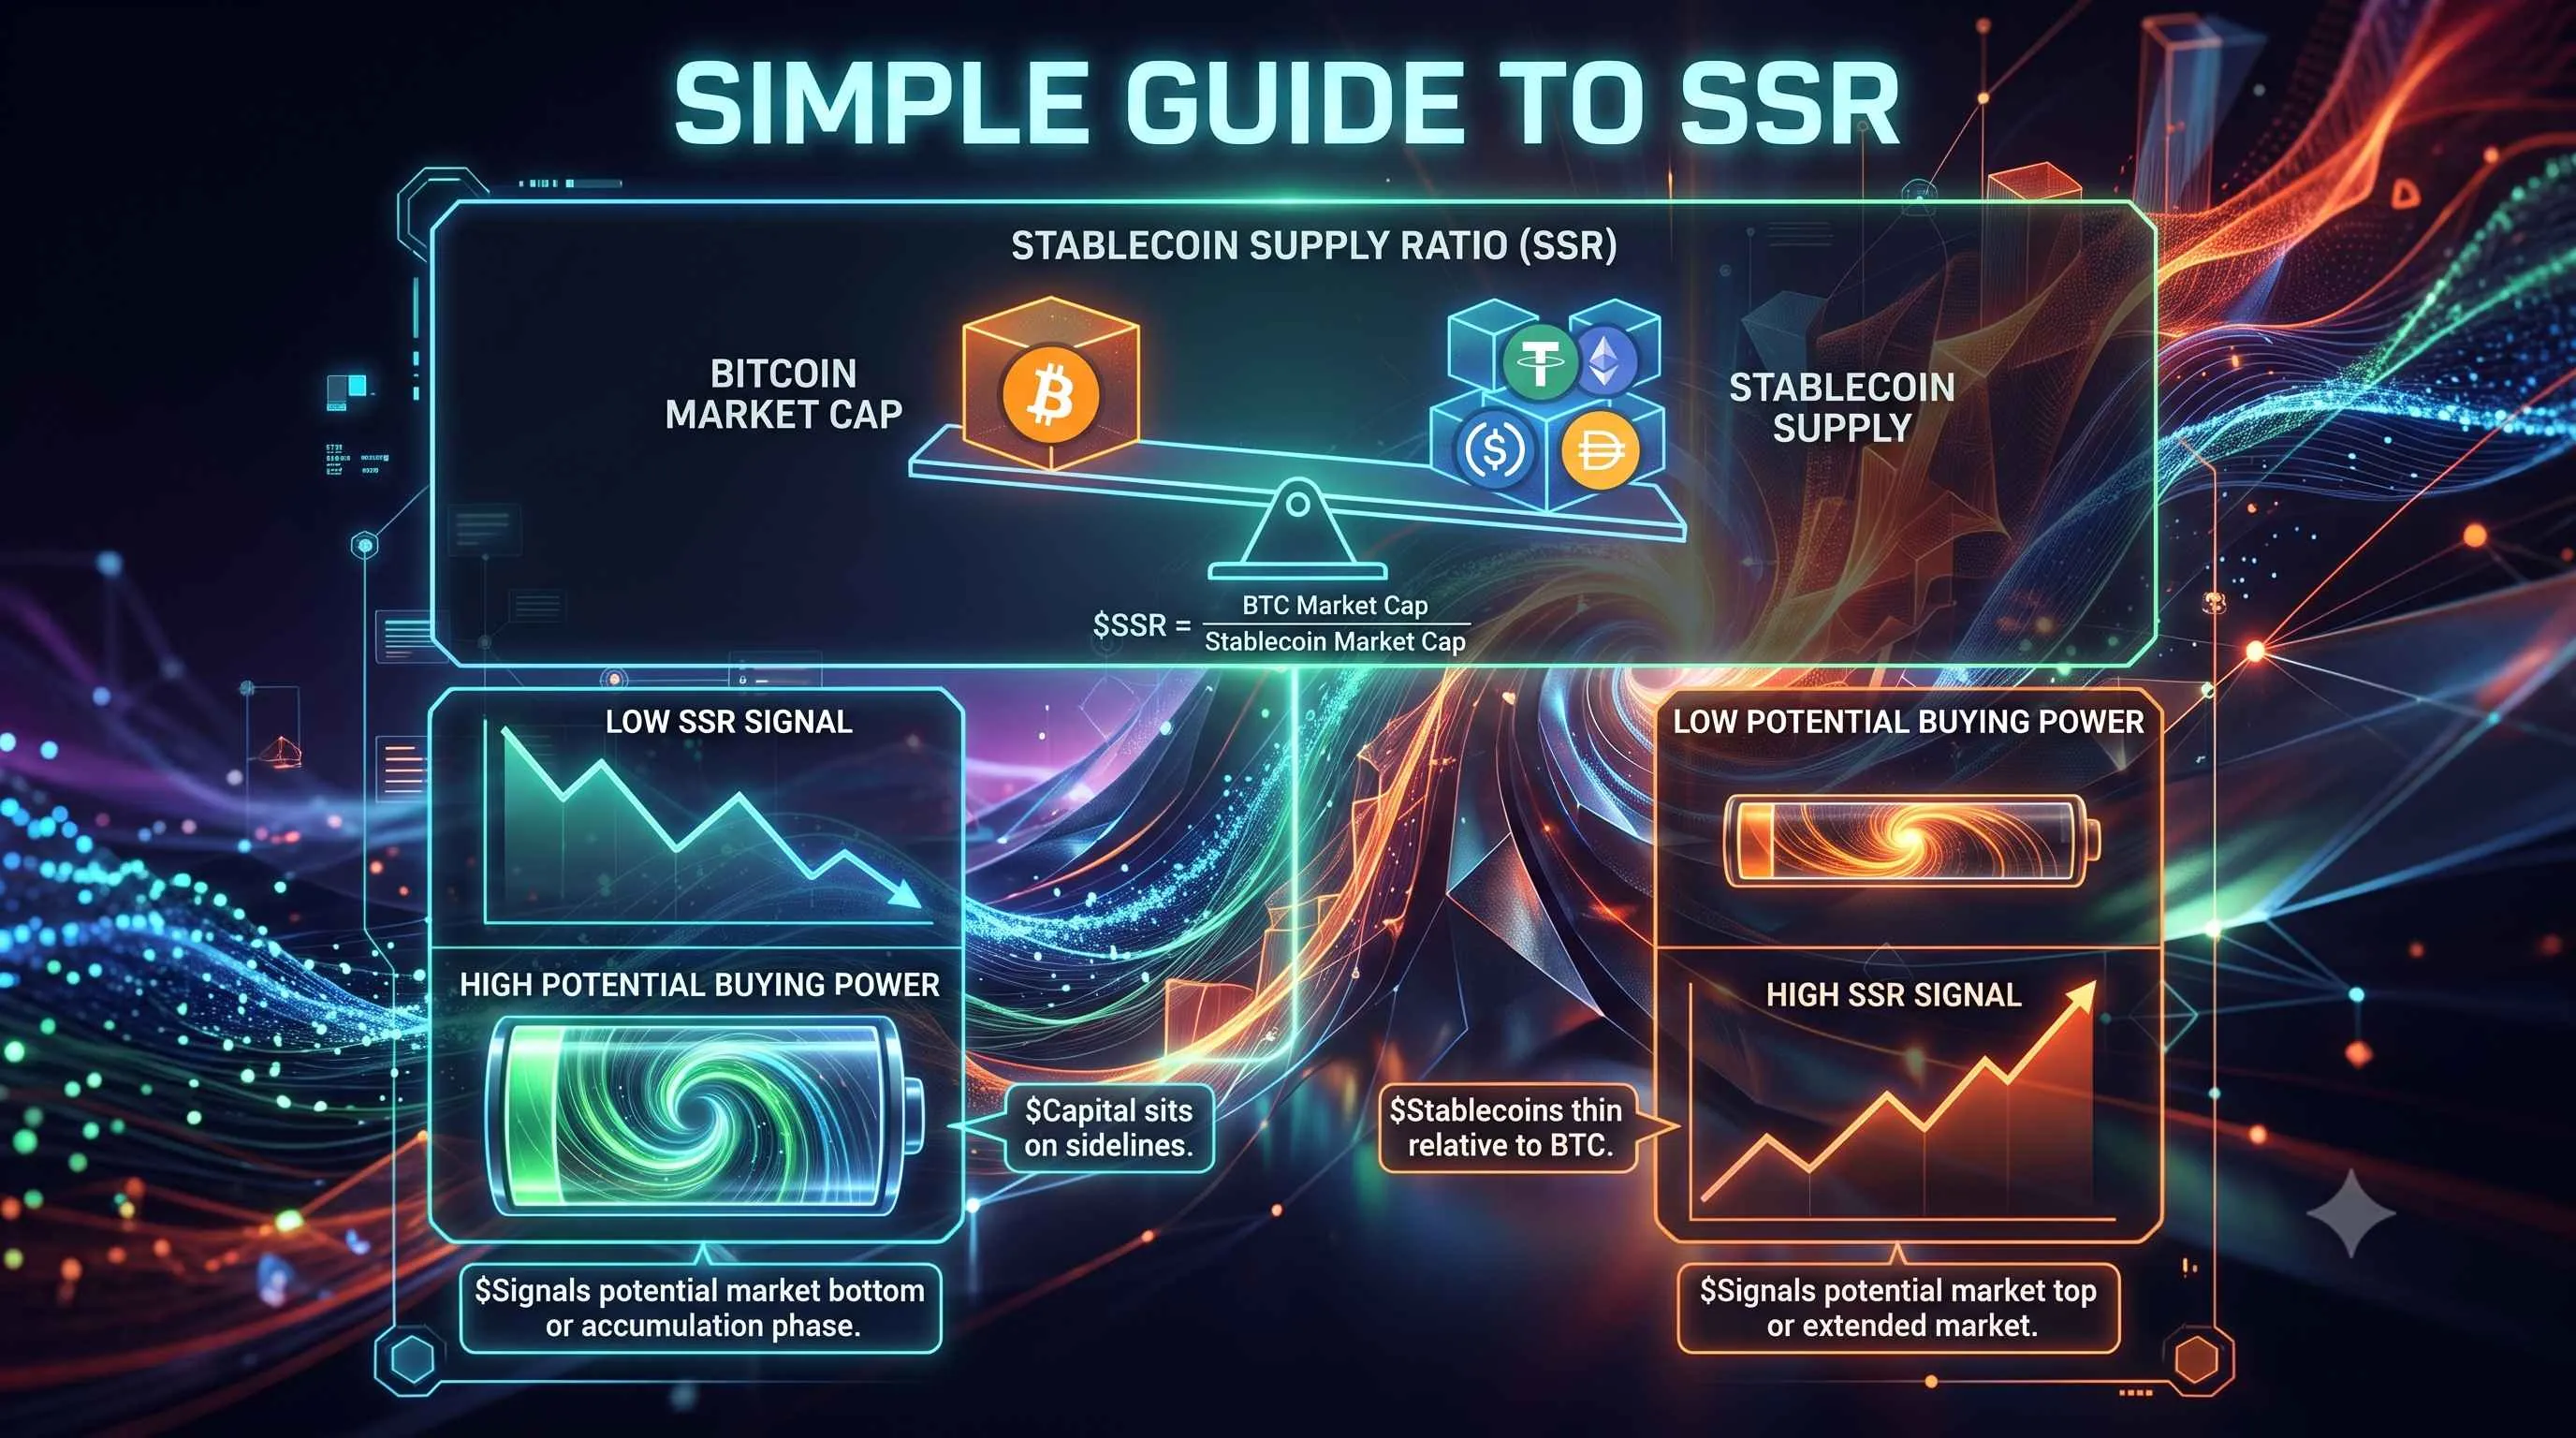
The Stablecoin Supply Ratio (SSR) is an on-chain metric that measures the ratio between the market capitalization of Bitcoin and the total market capitalization of major stablecoins. In essence, it acts as a proxy for the liquid "buying power" currently sitting on the sidelines of the crypto market.
The mathematical concept behind the metric can be expressed as follows:
When evaluating this relationship, think of stablecoins as dry powder. Because stablecoins are pegged to fiat currencies (primarily the US Dollar), their value remains relatively stable while the valuation of highly volatile assets like Bitcoin fluctuates. Therefore, the SSR shifts based on two primary variables: the price action of Bitcoin and the issuance or redemption of stablecoins.
Reading High vs. Low SSR Values
A High SSR Value: When the SSR is high, it indicates that Bitcoin's market capitalization is significantly larger than the aggregate supply of stablecoins. This suggests that the available stablecoin supply has relatively low purchasing power relative to Bitcoin's total value. In this environment, it requires a larger proportion of the existing stablecoin supply to move Bitcoin's price significantly, which may signal a highly extended market or diminished immediate buying pressure.
A Low SSR Value: Conversely, a low SSR value indicates that the total supply of stablecoins is high relative to Bitcoin’s market capitalization. This implies substantial "dry powder" is available in the ecosystem. A low SSR suggests high crypto buying power, meaning that if a significant portion of those stablecoins rotates back into volatile assets, it can exert notable upward price pressure.
How SSR Reflects Market Sentiment and Liquidity
Liquidity management and volume tracking are crucial components of evaluating market health. On-chain data reveals that stablecoin supply does not remain static; it expands and contracts based on macroeconomic factors, regulatory shifts, and institutional capital allocation.
The Mechanics of Supply Expansion
When global market sentiment leans bullish, capital often enters the crypto ecosystem through fiat-to-stablecoin on-ramps. As large entities mint billions of dollars in stablecoins (such as USDT or USDC), the denominator of the SSR equation grows. Even if the price of Bitcoin remains flat, this influx of stablecoins drops the SSR value, structurally increasing the aggregate crypto buying power.
Conversely, during periods of heightened market distress or broader economic contractions, capital may exit the ecosystem entirely via stablecoin redemptions. This reduces the circulating stablecoin supply, pushing the SSR higher and lowering overall systemic liquidity.
Volatility and Capital Rotation
The relationship between SSR and volatility management is highly cyclical. Historically, sharp drops in the SSR often coincide with market bottoms or accumulation phases. During these periods, investors hold large percentages of their portfolios in stablecoins to mitigate downside risk.
Once market sentiment stabilizes, this sidelined liquidity typically begins migrating into majors like Bitcoin and Ethereum, before eventually cascading down into mid-cap and small-cap pairs across decentralized exchanges (DEXs).
Integrating Macro SSR with Micro DEXTools Analysis
While the stablecoin supply ratio ssr provides an invaluable macro perspective on global crypto buying power, it is a lagging or concurrent structural indicator. It tells you that the ammunition is ready, but it does not tell you exactly where or when that capital will strike.
To bridge the gap between macro liquidity shifts and executable trade setups, traders must combine SSR analysis with real-time on-chain data using tools like DEXTools.
Step 1: Confirming Liquidity Influx via Pair Explorer
When the global SSR suggests high buying power (low ratio), your next objective is to identify where that capital is flowing. By utilizing the DEXTools Pair Explorer, you can monitor specific trading pairs across multiple blockchain networks to see if the global stablecoin supply is actively converting into asset volume.
Look for a confluence of factors:
An increase in aggregate trading volume across decentralized pairs.
Rising Total Value Locked (TVL) or pool liquidity in specific smart contracts.
A steady price action floor forming near major support levels.
If the macro SSR is low and you notice a localized increase in stablecoin liquidity within specific DEXTools pairs, it may indicate that the broader buying power is beginning to deploy.
Step 2: Analyzing Holder Distribution and Whale Activity
A low SSR tells us that stablecoins are abundant, but analyzing distribution ensures that smart money, rather than highly speculative retail capital, is driving the trend.
When capital rotates from stablecoins into individual tokens, you can use the Holder Analysis and integrated Bubblemaps features on DEXTools to verify the structural integrity of that allocation.
Whale Tracking: If a low SSR environment transitions into localized buying behavior, check the top wallet addresses. Is the asset being accumulated by a few highly concentrated wallets, or is it distributing evenly?
Wallet Interconnectedness: Bubblemaps allows you to visually inspect whether top holders are connected via historical transfers, helping you rule out artificial volume or wash trading that might distort your liquidity analysis.
Step 3: Spotting RSI Divergences and Key Support Zones
Macro indicators work best when paired with traditional technical analysis. When the SSR approaches historically low levels, look for momentum shifts on your charts.
RSI Divergence: If Bitcoin or a major altcoin is making lower lows on the daily chart, but the Relative Strength Index (RSI) is making higher lows, you have a bullish RSI divergence. If this occurs simultaneously with a declining SSR, the probability of a structural trend reversal may increase.
Support & Resistance: Identify long-term horizontal support zones on DEXTools charts. A retest of a major support level during a period of historically high stablecoin buying power presents a fundamentally different risk profile than a retest occurring when stablecoins are scarce.
Step-by-Step Framework for Monitoring Capital Flows
To systematically incorporate these elements into your routine, follow this operational framework:
Check the Macro Dashboard: Monitor aggregate on-chain platforms weekly to evaluate the current state of the Stablecoin Supply Ratio. Note whether the metric is trending toward historical upper bands (lower buying power) or lower bands (higher buying power).
Set Up Proactive Alerts: If the SSR signals that substantial buying power is available, use DEXTools Price Alerts on major reference pairs to notify you when specific technical thresholds or key resistance levels are broken.
Audit the Smart Contracts: Before following any capital rotation into decentralized pairs, use the DEXTools audit features to check the token's contract security, ensuring liquidity isn't locked in malicious configurations.
Monitor Top Traders: Utilize the Top Traders tab on DEXTools to observe whether profitable wallets are taking profits into stablecoins (which drives the local velocity of stablecoins up) or converting stablecoins into assets.
Conclusion and Risk Management
The stablecoin supply ratio ssr is a powerful structural indicator, but like all on-chain metrics, it operates purely on a probabilistic basis. A low SSR proves that crypto buying power exists, but it cannot force market participants to deploy that capital. Sidelined stablecoins can remain in fiat-pegged configurations for extended periods during prolonged macroeconomic uncertainty or secular bear markets.
Therefore, relying on a single metric to dictate an entire trading strategy introduces significant directional risk. Sophisticated participants mitigate this by treating SSR as an environmental context provider rather than an execution trigger. By cross-referencing global stablecoin metrics with localized volume, liquidity health, and holder distribution profiles via DEXTools, you can build a more comprehensive, data-driven view of the market's internal momentum.