How to Use RSI in Crypto Trading: Strategy 2026
— By Tony Rabbit in Tutorials
Learn how to use RSI in crypto trading: the 30 and 70 levels, divergence, trend context, and the common signal traps that catch beginners in 2026.
For the complete, up-to-date guide, read our full guide here.
RSI is strongest when paired with trend context. For that, read EMA vs SMA in Crypto and our Ichimoku Cloud guide.
RSI is one of the most popular indicators in crypto because it boils a complex question, "is this market overheated or exhausted?", down to a single line that swings between zero and one hundred. That simplicity is also its biggest trap. RSI is genuinely useful, but only when traders stop expecting it to call exact tops and bottoms by itself.
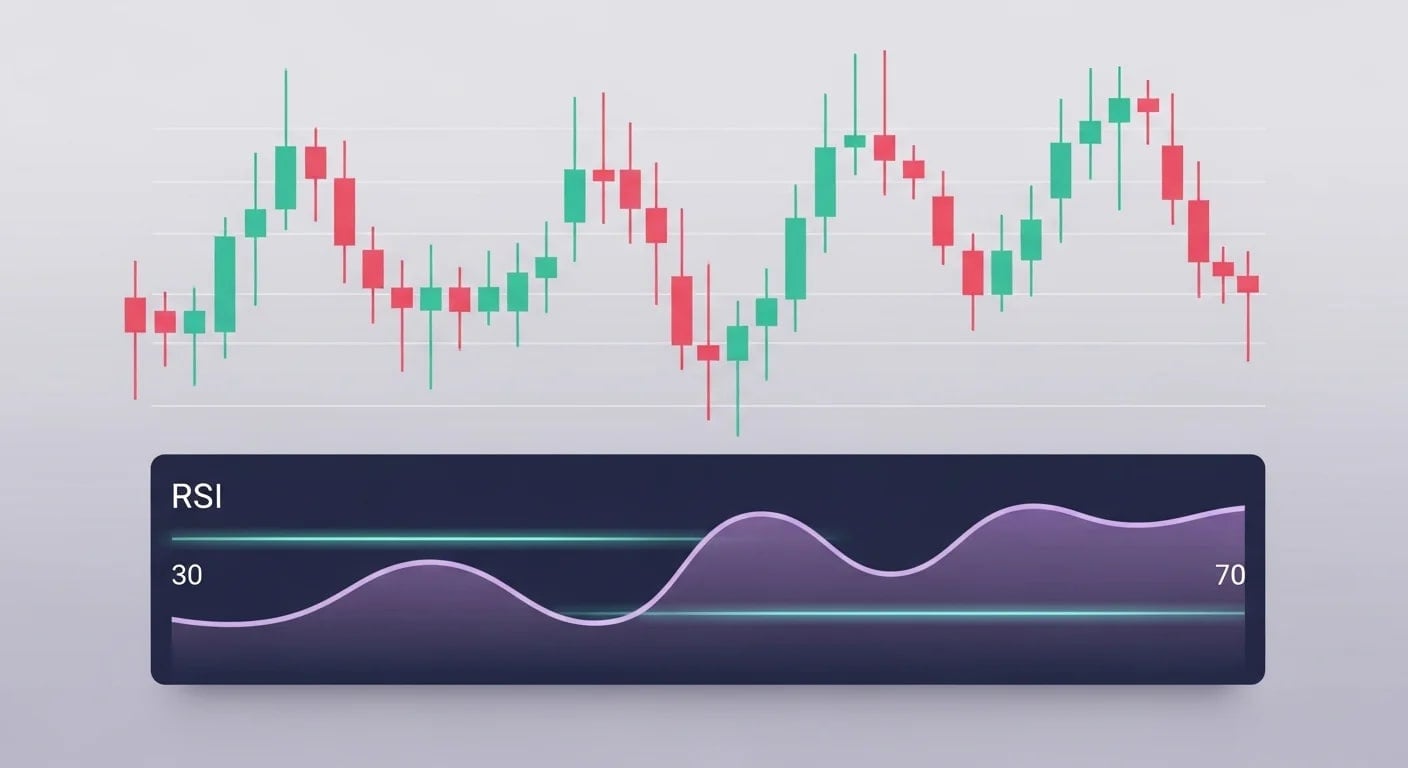
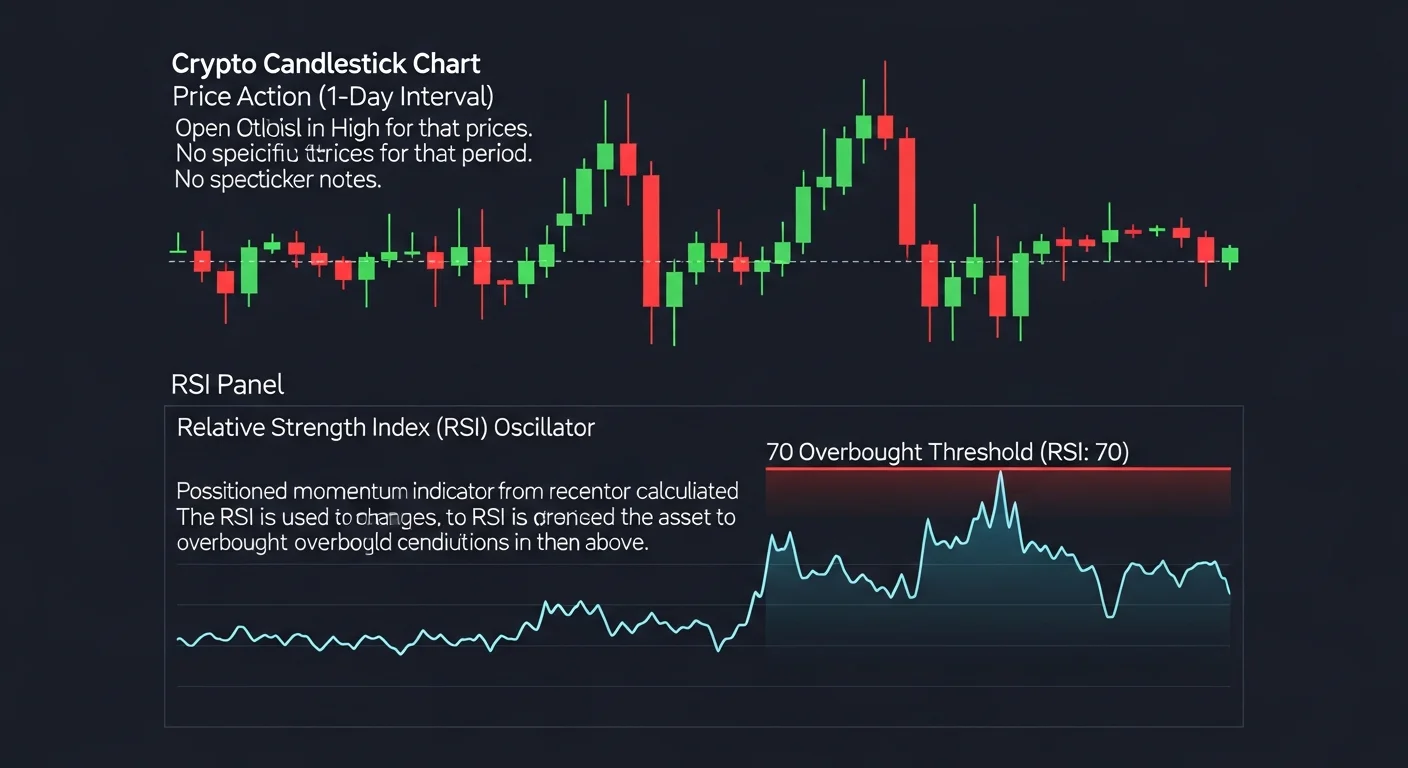
Quick answer: RSI in crypto stands for Relative Strength Index. It is a momentum oscillator that measures the speed and size of recent price moves on a 0-to-100 scale. Readings above 70 are commonly labeled overbought and readings below 30 are commonly labeled oversold, but in real markets RSI works best as a context tool that confirms structure, not as an automatic buy or sell signal.
- RSI measures momentum, not direction. A high RSI does not mean price must fall, only that recent momentum is strong.
- The 30 and 70 lines are conventions. Strong trends can stay above 70 or below 30 far longer than beginners expect.
- The midline is underrated. The 50 level often tells you which side of the market is currently in control.
- Divergence is an alert, not a command. It can warn that momentum is fading without telling you when price will react.
- Structure beats the indicator. RSI is sharpest when used at meaningful levels, not in the middle of a noisy chart.
What RSI is and how it is built
RSI stands for Relative Strength Index. Despite the name, it does not compare two different assets. It compares an asset to its own recent behavior. The indicator measures the average size of up moves against the average size of down moves over a chosen period, then converts that ratio into a value between zero and one hundred.
The default RSI period most traders start with is 14. That means the indicator looks back at the previous 14 candles, weighs the gains against the losses, and outputs a single line. You do not need to memorize the formula to use RSI well, but it helps to remember that this number is purely derived from past price. RSI does not see news, liquidity, or whales. It only describes how price has been moving.
The 0 to 100 scale
RSI cannot go below zero or above one hundred. Readings near 100 mean recent up moves have been overwhelmingly larger than recent down moves. Readings near zero mean the opposite. Most of the time RSI lives between 30 and 70, which is why those levels became the standard reference points for "stretched" momentum.
It is tempting to treat 30 and 70 as automatic buy and sell triggers, but markets rarely cooperate. A coin in a strong uptrend can sit above 70 for weeks. A coin in a brutal downtrend can sit below 30 for just as long. RSI is describing intensity, not handing out instructions.
Why RSI is useful, and why it is sometimes useless
RSI is useful because it normalizes momentum. Two charts with very different prices and volatility profiles can be compared on the same 0-to-100 scale. That makes it easier to scan watchlists, compare setups, and spot moments where momentum is genuinely unusual.
RSI becomes almost useless when traders apply it to thin, manipulated, or chop-bound markets. A micro-cap with five whales pushing the price will print "overbought" and "oversold" readings that mean nothing. The indicator only describes price, so if price itself is unreliable, RSI inherits that unreliability.
How to read RSI on crypto charts
The simplest RSI workflow has three checks: where is RSI relative to 50, is it touching an extreme zone, and does it agree or disagree with what price is doing? These three questions usually tell a beginner more than constant period tweaking.
Overbought and oversold in plain English
An overbought reading above 70 means recent up momentum has been strong. An oversold reading below 30 means recent down momentum has been strong. That is all. Neither reading guarantees a reversal. Many of the worst beginner trades come from shorting strength because RSI is "too high" or buying weakness because RSI is "too low" with no other reason behind the trade.
What overbought and oversold really do is flag moments worth a closer look. If a token is suddenly extended into resistance with RSI above 75, you have a more interesting situation than the same chart with RSI sitting at 55. The indicator is telling you the move has come fast, not that it must end now.
The 50 midline as a control map
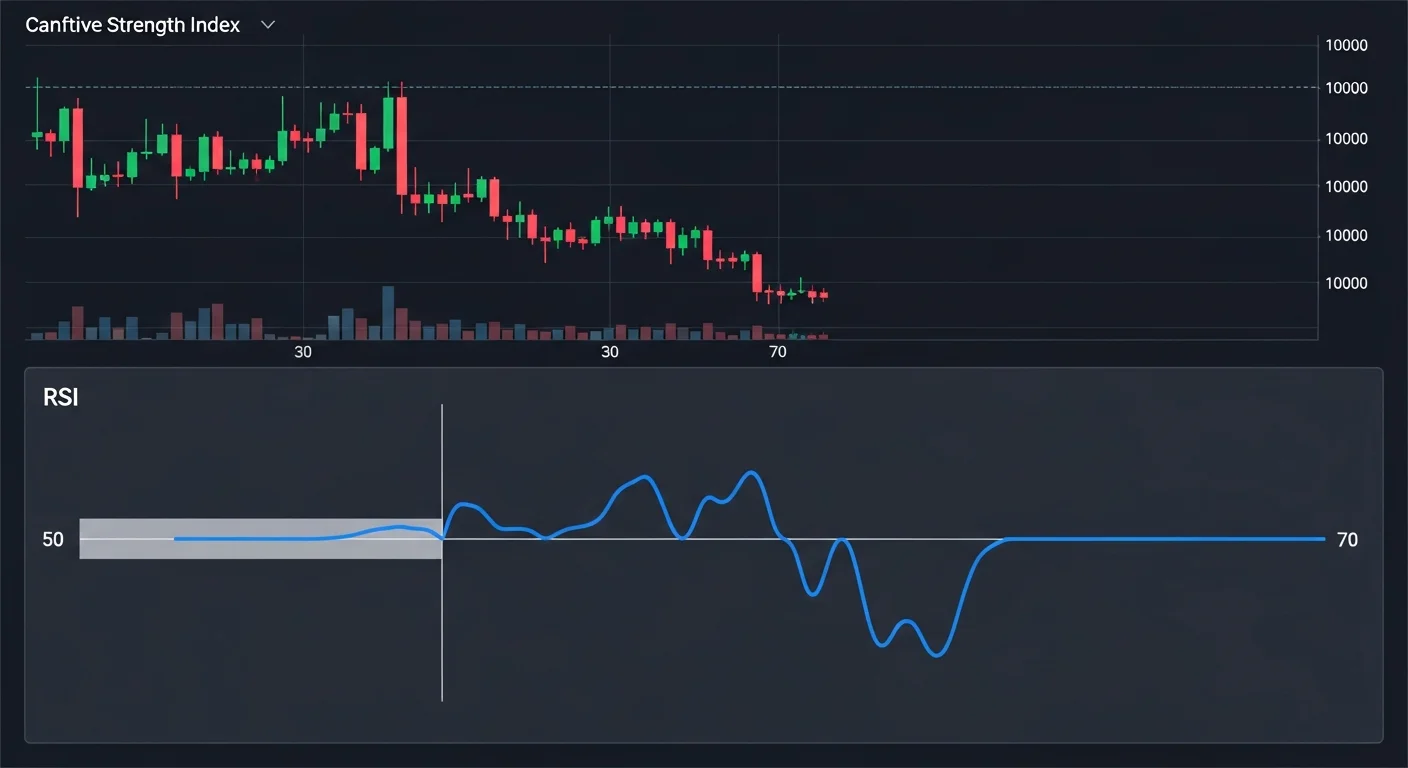
The midline at 50 is one of the most underrated parts of RSI. When RSI consistently holds above 50 on pullbacks and gets rejected from below, bulls are usually in control. When RSI repeatedly gets rejected from below 50, bears are usually in control. Watching how price behaves the first time RSI tests 50 from either side often gives a cleaner read than chasing the 30 and 70 extremes.
This is why many trend traders quietly use RSI as a regime filter. If the asset has been holding its 50 midline on every pullback, momentum is still constructive. If 50 starts breaking and RSI begins making lower highs, that is a meaningful shift that often shows up before price structure officially breaks.
Trend versus range markets
RSI behaves very differently in trends and in ranges. In a strong trend, RSI can stay near an extreme and the "wait for a reversion to the mean" logic fails repeatedly. In a clean range, RSI bouncing between 30 and 70 can line up nicely with support and resistance because the structure itself is mean-reverting.
The lesson is to identify the regime first. A trader who treats every overbought print as a short signal will be punished in a strong trend. A trader who buys every oversold print in a brutal downtrend will be punished even worse. The market regime decides whether RSI extremes are useful or misleading.
RSI divergence in plain English
Divergence is one of the most discussed RSI concepts and one of the most misused. Divergence happens when price makes a new extreme but RSI does not confirm with a matching momentum extreme. It can hint that the visible move is losing internal force.
Bullish divergence
A bullish divergence appears when price prints a lower low but RSI prints a higher low. The visible chart looks worse, yet the momentum measure has weakened the down move compared with the previous one. That can signal that selling pressure is no longer accelerating the way the price chart suggests.
For example, ETH might sell off into a long-defined support zone, dip slightly below the prior swing low, and frighten holders. If RSI prints a higher low at the same time, the breakdown is not being confirmed by momentum. That does not guarantee an immediate reversal, but it tells you to watch how price reacts at the level instead of assuming the breakdown will continue automatically.
Bearish divergence
A bearish divergence appears when price prints a higher high but RSI prints a lower high. The chart looks stronger on the surface while internal momentum is weaker than it was on the previous push. This commonly appears late in extended rallies, especially after a vertical move.
For example, BTC might break a previous local high, trigger breakout buying, and still show a lower RSI peak than it printed on the prior leg. That is not an automatic short signal. It is a warning that upside momentum is not accelerating the way the price action suggests, and that the next pullback may be deeper than usual.
Hidden divergence and continuation reads
Hidden divergence is the lesser-known cousin of regular divergence and often carries more weight in a trend. Hidden bullish divergence happens when price prints a higher low but RSI prints a lower low, suggesting the dip was deeper internally than it looked. In an uptrend, that often confirms the pullback was healthy and momentum is ready to resume.
Hidden bearish divergence is the inverse, and often appears as price prints a lower high while RSI prints a higher high. In a downtrend, that often confirms a relief rally without a real shift in trend control. Both versions are continuation tools, not reversal tools, and they tend to be more reliable than regular divergence in genuinely trending markets.
RSI setups traders actually use
RSI becomes practical when it is attached to real situations instead of treated as a standalone gadget.
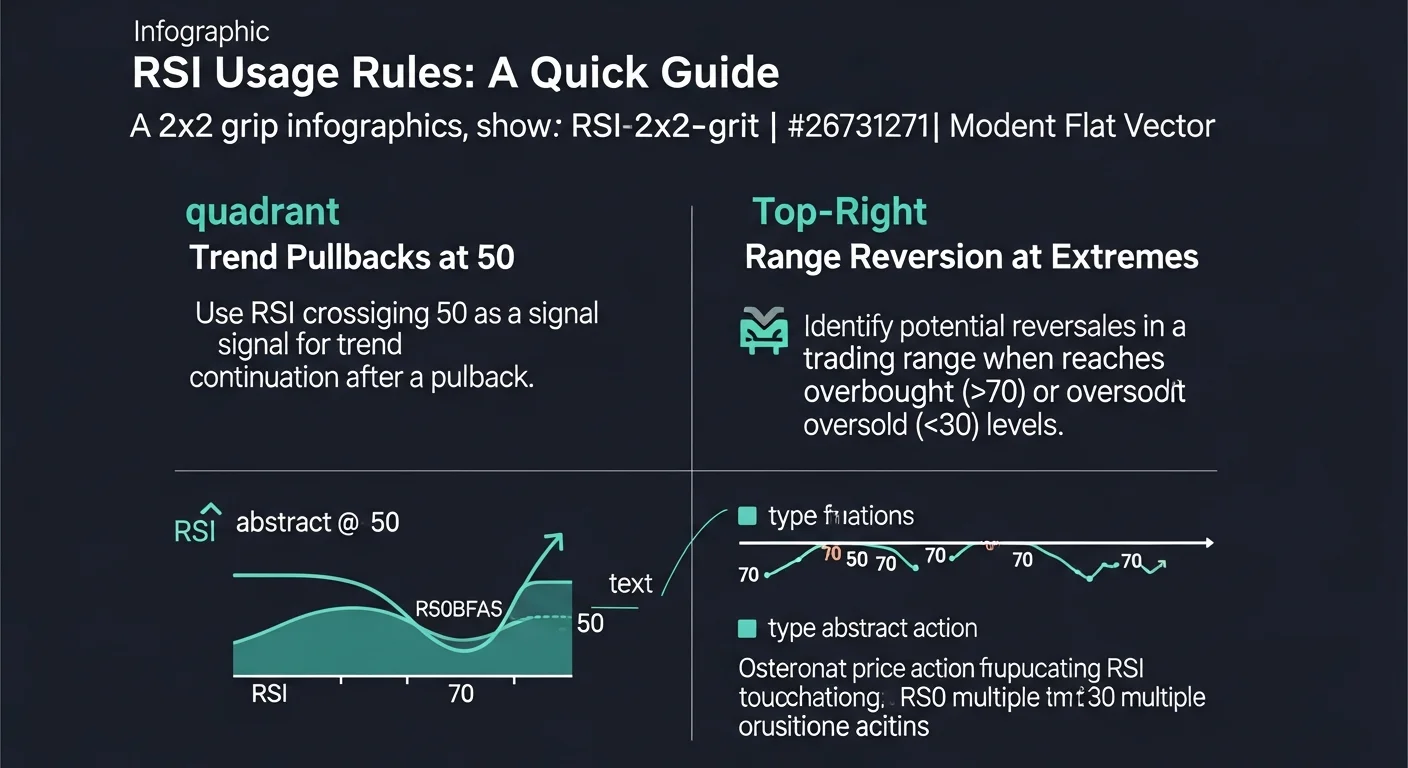
Trend pullbacks at the midline
One common use is a pullback inside an established uptrend. Price retraces into a known support area, RSI dips toward 50 without breaking it convincingly, and then reclaims as price reclaims the level. Here, RSI is not creating the trade. It is confirming that momentum is realigning with the existing trend.
Range mean reversion at extremes
Inside a clear range, RSI often respects 30 and 70 because the structure itself is mean reverting. When price tests the lower edge of the range with an oversold RSI, both pieces of evidence point to the same idea. The trade still requires a level. RSI alone is not the reason.
Momentum exhaustion after vertical moves
RSI also helps spot exhaustion. After a vertical move into a major level, an extreme RSI plus shrinking volume plus a long upper wick is a more interesting exhaustion picture than any of those signals alone. The trader is not predicting the top. They are recognizing that the conditions for a sharp pullback are unusually concentrated.
Common RSI misuse and false signals
Most RSI problems come from forcing the indicator to do a job it was never designed to do.
- Shorting every overbought reading: in strong trends, RSI can stay above 70 indefinitely while price keeps grinding higher.
- Buying every oversold reading: in brutal downtrends, RSI can stay below 30 for days while price continues to bleed.
- Trading divergence in the middle of nowhere: divergence at random price levels often resolves with no follow-through.
- Using RSI on illiquid pairs: a thin chart with whale-driven candles makes RSI extremes meaningless.
- Over-tuning the period: changing 14 to a custom value just because the last chart looked messy usually creates false confidence rather than better signals.
The simple rule is: structure first, indicator second. If the chart has no thesis, RSI cannot invent one.

What settings and timeframes work best
The default 14-period RSI is widely used because it offers a reasonable balance between smoothing and reactivity. Shorter periods such as 7 react faster but generate more whipsaw signals. Longer periods such as 21 smooth more but lag more. None of those choices are inherently better. They are different tradeoffs.
Timeframe matters at least as much as the period. Many traders find RSI cleaner on the four-hour, daily, and weekly charts because there is less random noise. On the one-minute and five-minute charts, RSI can still help with execution, but signals churn far more often and require tighter context to be useful.
Custom periods only make sense as part of a tested process. Tweaking RSI because today's chart looks ugly is a sign that the trader is trying to force clarity out of an unclear market.
Practical workflow for DEXTools and TradingView users
The cleanest workflow is to filter pairs first, mark structure second, and only then bring in RSI. Use DEXTools to confirm the pair has enough liquidity and orderly price action to even respect technical levels. Then move to your charting tool and identify support, resistance, and trend context. Only after that should the indicator enter the picture.
- Build a watchlist of liquid, readable pairs. Indicator work is only as good as the chart underneath it.
- Mark structure before opening RSI. Levels matter more than oscillator readings.
- Use RSI as confirmation. Ask whether momentum supports the level test, pullback, or breakout you already identified.
- Cross-check with companion tools. MACD, liquidity pool data, and fundamental analysis often resolve the cases where RSI alone is ambiguous.
If you need broader chart-reading help, hand readers to how to read crypto candlestick charts instead of turning this article into a chart-school detour.
RSI vs MACD in one short comparison
RSI and MACD often appear together because they answer different questions. RSI is usually cleaner for momentum extremes and overbought or oversold context. MACD is usually stronger for momentum shifts and trend continuation. Neither replaces structure, and neither needs to do the other indicator's job.
| Indicator | Usually stronger for | Main caution |
|---|---|---|
| RSI | Overbought and oversold context, momentum extremes | Can stay extreme during strong trends |
| MACD | Momentum shifts, trend continuation, crossovers | Can lag during fast moves |
Frequently asked questions
What does RSI stand for in crypto trading?
RSI stands for Relative Strength Index. It is a momentum oscillator that scores recent price action on a 0-to-100 scale to help traders read whether momentum is unusually strong, weak, or shifting.
Is RSI a good indicator for crypto beginners?
Yes, if beginners use it as confirmation around chart structure rather than as an automatic buy or sell signal. The 30 and 70 lines are reference points, not commands.
What RSI settings work best for crypto?
The default 14-period RSI is the most common starting point. Shorter periods react faster but whipsaw more, and longer periods smooth more but lag. The right choice is the one a trader can apply consistently.
Is RSI better than MACD for crypto trading?
Not universally. RSI tends to be cleaner for momentum extremes, while MACD is often stronger for momentum shifts and trend continuation. Many traders use both because they answer slightly different questions.
Which timeframe is best for RSI in crypto?
There is no single best timeframe, but many traders find RSI cleaner on higher timeframes than on very noisy lower ones. The faster the chart, the more carefully RSI signals should be treated.
Final takeaway: RSI is useful because it makes momentum readable on a fixed 0-to-100 scale. It becomes dangerous only when traders ask it to call exact tops and bottoms alone. Use structure first, use RSI second, and let the indicator confirm a trade instead of inventing one.
Disclaimer: This guide is for educational purposes only and does not constitute investment, financial, legal, or trading advice. Indicators can improve context, but they do not remove risk.
Related Guides
- What Is RSI Divergence in Crypto Trading? 2026 Guide
- What Is RSI in Crypto? Beginner Guide to the Relative Strength Index (2026)
- What Is Grid Trading in Crypto? Range-Bound Strategy Mechanics Explained (2026)
- Memecoin Trading Strategy: When to Take Profits
- DEXTools Workflow Strategy for Smart DeFi Trading (2026)
Frequently Asked Questions
What is RSI in crypto trading?
RSI, or Relative Strength Index, is a momentum indicator that measures the speed and size of recent price changes on a scale from 0 to 100. Traders use it to gauge whether an asset may be overbought or oversold.
What do the 30 and 70 RSI levels mean?
An RSI above 70 is often read as potentially overbought, while an RSI below 30 is often read as potentially oversold. These are general reference levels, not automatic buy or sell signals, and they work best alongside other analysis.
What is RSI divergence?
RSI divergence happens when price and the RSI move in opposite directions, such as price making a new high while RSI does not. Many traders treat divergence as a possible early warning that momentum is weakening.
Why does trend context matter when using RSI?
In a strong trend, RSI can stay overbought or oversold for a long time, so acting on those levels alone can be a trap. Reading RSI together with the broader trend helps avoid trading against strong momentum.