What Is RSI in Crypto? Beginner Guide to the Index
— By Tony Rabbit in Tutorials

RSI in crypto explained for beginners: learn how the Relative Strength Index works, what overbought and oversold mean, and how to use RSI with trends.
What is RSI in crypto? RSI stands for Relative Strength Index, a momentum indicator that tries to show when price movement is getting stretched. Traders mostly use it to judge overbought and oversold conditions, momentum shifts, and divergence.
The important part is that RSI is not a magic buy or sell button. It works best when you read it with trend, structure, and context. This guide explains what RSI means, how it is calculated, and how crypto traders actually use it in practice.
In this guide, we break down everything you need to know about RSI in crypto trading. From the formula and default settings to real Bitcoin examples, divergence patterns, combo strategies, and common mistakes. Whether you are a beginner learning how to read crypto charts or an experienced trader refining your strategy, this is the most complete RSI resource you will find.
What Is RSI (Relative Strength Index)?
The Relative Strength Index is a momentum oscillator that measures the speed and magnitude of recent price changes. It answers a simple question: over a given period, has the asset been closing higher or lower more often, and by how much? The result is a single number between 0 and 100 that tells you whether buying pressure or selling pressure is dominating.
An RSI reading above 70 is generally considered overbought, meaning the price has risen aggressively and may be due for a pullback. An RSI reading below 30 is considered oversold, meaning the price has dropped sharply and may be due for a bounce. The area between 30 and 70 is considered neutral territory, though the 50 level itself acts as an important midpoint.
RSI Formula
Oversold (Buy signal)
Neutral zone
Overbought (Sell signal)
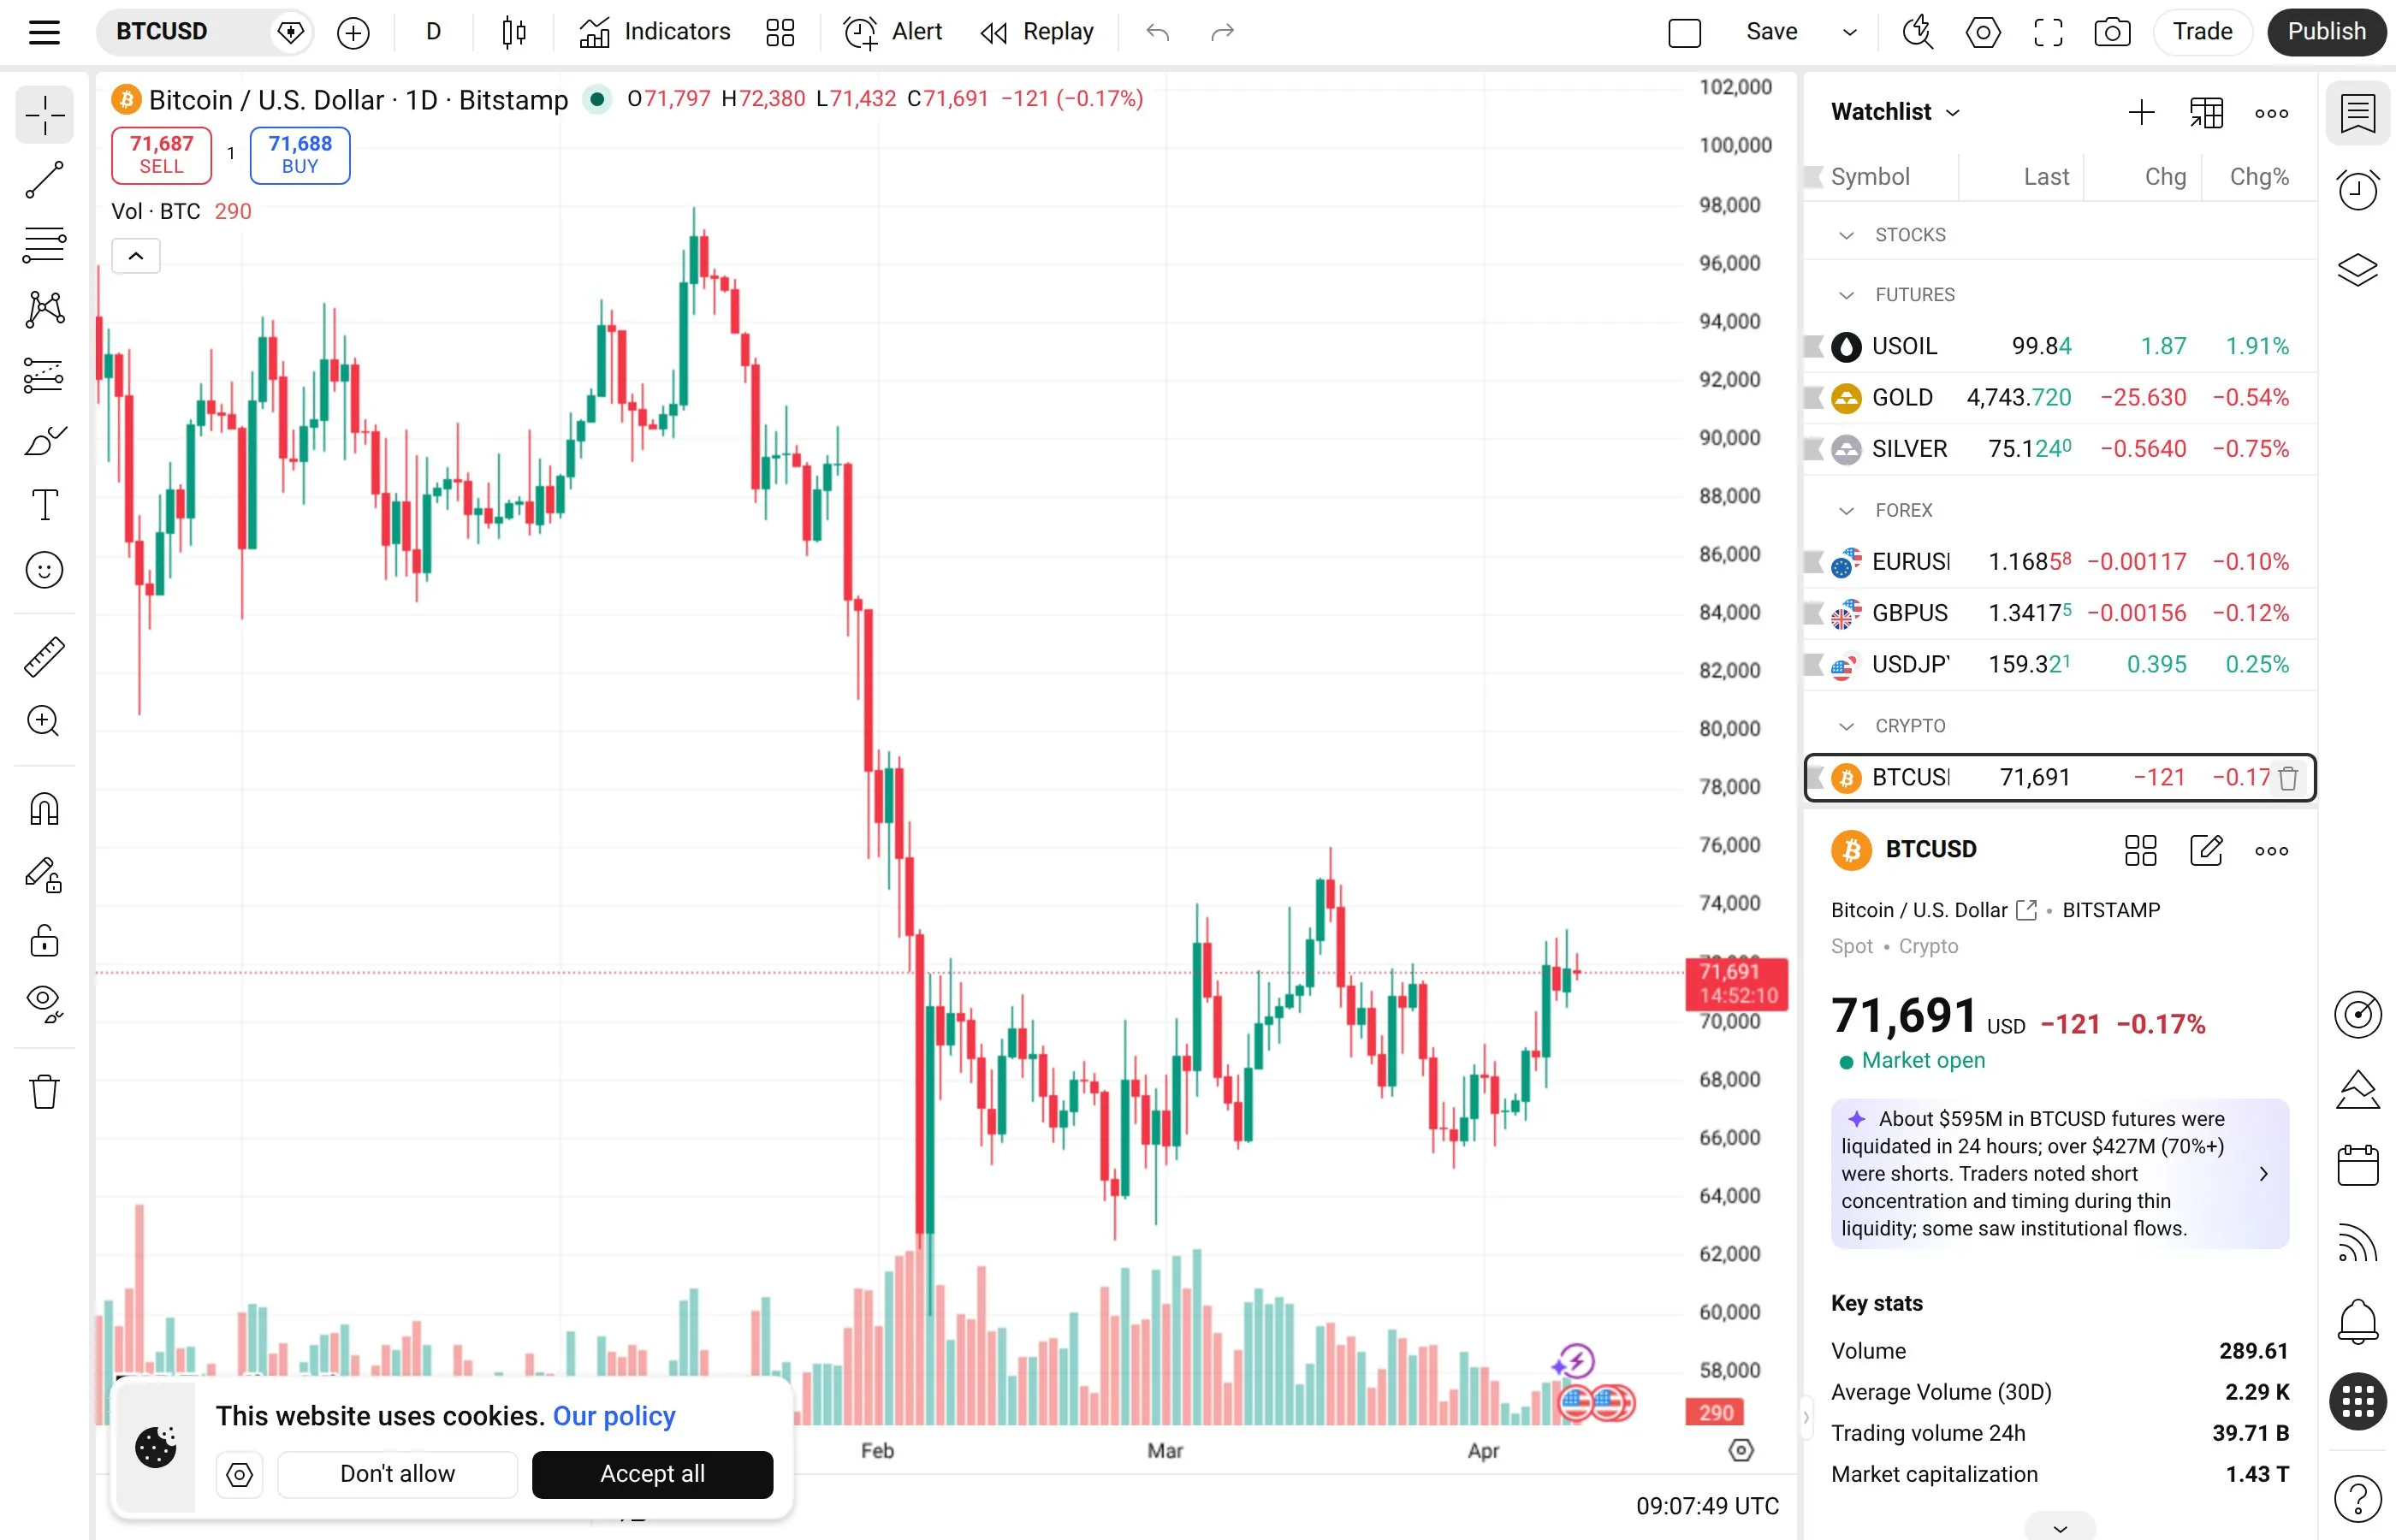
For crypto specifically, RSI is valuable because digital assets tend to experience more violent price swings than traditional stocks or forex. Bitcoin can move 10-20% in a single week, and altcoins can swing 30-50%. RSI helps quantify these moves and tells you when momentum is reaching extreme levels. If you are using platforms like TradingView for crypto charting, the RSI indicator is available by default and takes seconds to add to any chart.
The RSI Formula Explained
Understanding the math behind RSI helps you interpret the indicator more effectively. The calculation uses two steps. First, you calculate the Relative Strength (RS), then you convert it into the RSI value.
RSI Formula:
Step 1: RS = Average Gain (over N periods) / Average Loss (over N periods)
Step 2: RSI = 100 - (100 / (1 + RS))
Default period (N) = 14 candles
Here is how it works in practice. The indicator looks at the last 14 candles by default. It separates the closing price changes into gains (up candles) and losses (down candles). It then calculates the average gain and average loss over those 14 periods. If the average gain is larger than the average loss, RS will be greater than 1, and RSI will be above 50. If losses dominate, RS will be less than 1, and RSI will be below 50.
For example, if over the last 14 daily candles Bitcoin had an average gain of 2.5% on up days and an average loss of 1.0% on down days, the RS would be 2.5. Plugging that in: RSI = 100 - (100 / (1 + 2.5)) = 100 - 28.57 = 71.43. That reading of 71.43 would place BTC just into overbought territory.
After the initial 14-period calculation, RSI uses a smoothing formula (exponential moving average) for subsequent values. This means RSI reacts gradually to new data rather than jumping erratically, which makes it more reliable as a momentum gauge.
RSI Zones Visual Guide
How to Read RSI on a Crypto Chart
Reading RSI is straightforward once you understand the zones. The indicator appears as a line graph below your price chart, oscillating between 0 and 100. Most charting platforms draw horizontal lines at 30 and 70 by default to mark the oversold and overbought thresholds. When the RSI line crosses above 70, the asset is considered overbought. When it drops below 30, it is considered oversold.
But reading RSI goes beyond just checking if the number is above 70 or below 30. The direction of the RSI line matters. A rising RSI indicates increasing bullish momentum, while a falling RSI indicates increasing bearish momentum. The speed at which RSI moves also matters. A sharp spike to 80+ suggests aggressive buying that may exhaust quickly, while a gradual climb to 72 suggests sustained buying pressure.
The 50 level is often overlooked but critically important. In an uptrend, RSI tends to stay between 40 and 90, using the 40-50 area as support. In a downtrend, RSI typically ranges between 10 and 60, with the 50-60 area acting as resistance. Watching how RSI interacts with the 50 level can tell you whether the overall trend is bullish or bearish.
Real Bitcoin RSI Examples (2025-2026)
Let us look at actual BTC price action to see RSI in context. In December 2025, Bitcoin rallied aggressively toward its cycle highs after months of accumulation. The daily RSI reached 89, deep into overbought territory. For traders watching this level, it was a clear warning that momentum was overextended. In the weeks that followed, BTC pulled back approximately 18% as profit-taking kicked in. Traders who used the overbought RSI reading as a signal to reduce exposure or set tighter stop-losses protected their capital effectively.
Conversely, in March 2026 during a broader market correction, Bitcoin's daily RSI dropped to 22. That is well below the 30 oversold threshold, signaling extreme selling pressure. Historically, BTC rarely stays below RSI 25 for more than a few days on the daily chart. Traders who recognized this oversold condition and accumulated had an excellent entry point as BTC bounced over 25% in the following three weeks.
These are not cherry-picked examples. If you pull up TradingView and scroll through BTC's daily chart, you will see this pattern repeat consistently. Extreme RSI readings (above 85 or below 25) on the daily timeframe almost always precede at least a short-term reversal. The key insight is that RSI does not predict the reversal timing, but it tells you that conditions are extreme and the probability of a reversal is increasing.
Another notable example occurred in January 2026 when Bitcoin consolidated between $92,000 and $98,000 for several weeks. During this range, the daily RSI hovered between 45 and 55, reflecting the indecision in the market. When RSI finally broke above 55 with conviction, it preceded the next leg up. Traders who used the RSI 50-level breakout as confirmation entered the move early.
RSI Divergence Patterns
Divergence is one of the most powerful RSI signals and something that separates beginners from experienced traders. Divergence occurs when the price action and the RSI indicator move in opposite directions. This conflict between price and momentum often signals that the current trend is weakening and a reversal may be approaching.
There are two types of RSI divergence. Bullish divergence happens when the price makes a lower low but RSI makes a higher low. This tells you that even though the price dropped further, selling momentum is actually weakening. It is a signal that buyers are stepping in more aggressively on each dip. Bearish divergence is the opposite: the price makes a higher high but RSI makes a lower high. This means that even though the price pushed higher, buying momentum is fading. Sellers are gaining strength on each rally.
▲ Bullish Divergence
Price Action:
Lower Low ↓
RSI Reading:
Higher Low ↑
Selling pressure is weakening. Expect a bounce or trend reversal to the upside.
▼ Bearish Divergence
Price Action:
Higher High ↑
RSI Reading:
Lower High ↓
Buying pressure is fading. Expect a pullback or trend reversal to the downside.
Divergence works best when combined with support and resistance levels. For example, if you see bullish divergence forming right at a known support zone, the probability of a bounce increases significantly. Many professional traders consider divergence-at-support or divergence-at-resistance to be among the highest-probability setups in all of technical analysis.
Hidden divergence is another variation worth knowing. Hidden bullish divergence occurs when the price makes a higher low but RSI makes a lower low. This actually confirms the uptrend continuation rather than signaling a reversal. Hidden bearish divergence is when price makes a lower high but RSI makes a higher high, confirming downtrend continuation. These hidden signals are useful for trend-following strategies.
RSI + MACD Combo Strategy
One of the most effective ways to use RSI is by combining it with the MACD (Moving Average Convergence Divergence) indicator. RSI tells you about momentum extremes, while MACD helps confirm trend direction and crossover signals. When both indicators align, the probability of a successful trade increases substantially.
Here is the combo strategy breakdown. For a buy signal, you want RSI below 35 (approaching oversold) AND a MACD bullish crossover (the MACD line crossing above the signal line). The RSI confirms that selling is overextended, and the MACD confirms that momentum is actually shifting from bearish to bullish. For a sell signal, look for RSI above 65 AND a MACD bearish crossover.
This dual-confirmation approach filters out many false signals. RSI alone might show oversold conditions during a strong downtrend, and buying every oversold reading would be a losing strategy. But when MACD also shows a bullish crossover while RSI is oversold, it means momentum is genuinely shifting. If you are learning how to day trade crypto, this combo is one of the first multi-indicator strategies you should master.
Advanced traders also look for RSI divergence combined with MACD histogram divergence. When both indicators show divergence simultaneously, it creates an even stronger signal. For example, if the price makes a lower low, RSI makes a higher low, AND the MACD histogram makes a higher low, you have triple confirmation that selling momentum is exhausted.
RSI + Volume Confirmation
Volume is the fuel that drives price movement, and combining RSI with volume analysis creates a powerful confirmation system. When RSI reaches overbought or oversold levels, the next question should always be: what is volume doing? High volume at RSI extremes tells a different story than low volume at RSI extremes.
When RSI drops below 30 on high volume, it often indicates a capitulation event. This is when weak hands are panic selling and smart money is accumulating. Capitulation oversold readings tend to produce the sharpest reversals. Conversely, when RSI drops below 30 on low volume, it may just indicate a lack of buying interest rather than active selling, and the price could continue drifting lower.
For overbought signals, RSI above 70 on declining volume is a warning sign. It means the price is pushing higher but fewer participants are driving the move. This volume-momentum divergence often precedes significant pullbacks. If you are using tools like DEXTools to analyze token volume alongside RSI, you can spot these setups on altcoins and DeFi tokens as well.
RSI Across Different Timeframes
RSI behaves differently depending on the timeframe you are analyzing. Understanding these differences is crucial for applying RSI correctly to your trading style. The four main timeframes crypto traders use are 1-hour, 4-hour, daily, and weekly.
On the 1-hour chart, RSI is highly reactive and produces frequent overbought and oversold signals. This makes it useful for scalping and short-term day trading but also means more false signals. RSI can bounce between 30 and 70 multiple times in a single day on the 1H chart. Day traders often use tighter RSI levels (25/75 instead of 30/70) on this timeframe to filter out noise.
The 4-hour chart offers a good balance between signal frequency and reliability. RSI overbought and oversold readings on the 4H chart typically precede moves that last 1-3 days. Swing traders favor this timeframe because it gives enough signals to trade actively while maintaining reasonable accuracy. Many traders on Binance and Bybit use the 4H RSI as their primary indicator.
The daily chart is the gold standard for RSI analysis. RSI extremes on the daily chart carry significant weight because they represent the cumulative momentum of an entire trading day. When BTC's daily RSI hits 85+ or drops below 20, it almost always leads to a meaningful reversal within 1-2 weeks. Long-term investors and position traders rely heavily on daily RSI.
Weekly RSI is the macro view. It rarely reaches extreme levels, but when it does, the implications are major. Bitcoin's weekly RSI reaching 90+ has historically coincided with cycle tops (late 2017, early 2021). Weekly RSI dropping below 30 has marked generational buying opportunities. If you are building a long-term crypto portfolio, weekly RSI is the timeframe to watch.
Best RSI Settings for Crypto: 9 vs 14 vs 25
The default RSI period is 14, which was Wilder's original recommendation. But crypto markets move faster than the traditional markets Wilder designed for, so many crypto traders adjust the period setting. The three most popular settings are 9, 14, and 25, and each serves a different purpose.
RSI 9 (short period) is more sensitive and produces faster signals. It crosses overbought and oversold levels more frequently, which makes it better for short-term trading and scalping on lower timeframes. The downside is more false signals. If you are a day trader using the 15-minute or 1-hour chart, RSI 9 gives you quicker entries and exits. Just be prepared for more whipsaws.
RSI 14 (default period) remains the most balanced setting and is the standard that most traders use. It provides a good mix of signal frequency and reliability across all timeframes. If you are unsure which setting to use, stick with 14. It is the setting that the majority of the market is watching, which creates a self-fulfilling prophecy effect at key levels like 30 and 70.
RSI 25 (long period) smooths out the indicator significantly and produces fewer but more reliable signals. It is best suited for daily and weekly charts where you want to identify only the most significant momentum extremes. RSI 25 on the daily chart will barely reach overbought or oversold levels, but when it does, the signal carries substantial weight. Swing traders and investors who practice dollar-cost averaging use RSI 25 to time their larger accumulation entries.
Quick RSI Settings Reference
| Setting | Best For | Timeframe | Signal Frequency |
|---|---|---|---|
| RSI 9 | Scalping, day trading | 5m, 15m, 1H | High (more false signals) |
| RSI 14 | All-purpose trading | 1H, 4H, Daily | Medium (balanced) |
| RSI 25 | Swing trading, investing | Daily, Weekly | Low (high reliability) |
When RSI Fails: Trending Market Traps
RSI is not infallible, and one of the biggest mistakes traders make is treating every overbought or oversold reading as an automatic trade signal. RSI can and does fail, particularly in strong trending markets. Understanding when RSI is unreliable is just as important as knowing when to trust it.
In a strong uptrend, RSI can remain above 70 for weeks or even months. During Bitcoin's major rallies, the daily RSI has stayed in the 70-90 range for extended periods while the price continued climbing. Selling every time RSI hit 70 during a bull run would have meant selling the bottom of the next leg up. In strong trends, overbought does not mean overvalued. It means strong momentum.
The same applies in downtrends. RSI can stay below 30 for extended periods during bear markets. Buying every oversold reading in a bear market is a recipe for catching falling knives. The asset is oversold for a reason, and RSI staying oversold just confirms that selling pressure is relentless.
The solution is context. Before acting on an RSI signal, determine the broader trend using higher timeframes. If the weekly chart shows a clear uptrend, treat daily RSI oversold readings as buying opportunities but treat overbought readings with skepticism. In a downtrend, reverse this approach. RSI works best as a reversal tool in range-bound markets and as a pullback-entry tool in trending markets.
Another RSI failure mode is low-volume environments. During weekends or holidays when crypto trading volume drops, RSI can give misleading signals because small trades can move the price disproportionately. Always cross-reference RSI with volume before making trading decisions.
When NOT to Use RSI
While RSI is versatile, there are specific scenarios where you should set it aside or at least not rely on it as your primary indicator. Knowing when not to use a tool is a sign of trading maturity.
During major news events, RSI becomes unreliable. When Bitcoin reacts to a Federal Reserve decision, a regulatory announcement, or a major hack, the price movement is driven by narrative and panic, not technical momentum. RSI will flash extreme readings, but these readings do not carry the same predictive value as they do during normal market conditions. News-driven moves can push through overbought and oversold levels without any reversal.
On very low-cap altcoins and meme tokens, RSI is often meaningless. These assets can be moved by a single large wallet, and their price action does not reflect genuine market momentum. A meme coin can go from RSI 30 to RSI 90 in an hour on a single whale buy, then crash back. Technical indicators assume a reasonably liquid market with many participants, and micro-caps often do not meet that threshold.
In the first few hours of a new token listing, RSI has no historical context to work with. The indicator needs at least 14 periods of data to calculate properly (or 9 or 25, depending on your setting). Trading a freshly listed token based on RSI with only a handful of candles is not technical analysis. It is guessing with a number attached.
Finally, do not use RSI in isolation. It was never designed to be a standalone trading system. RSI should always be combined with at least one other form of analysis: price action patterns, support and resistance levels, volume, MACD, or moving averages. If you are interested in how leverage trading amplifies both signals and risks, combining RSI with multiple confirmations becomes even more critical.
RSI Pros and Cons
Pros
- Simple to read and interpret for beginners
- Works across all timeframes and crypto assets
- Excellent for identifying momentum extremes
- Divergence signals are highly reliable
- Available on every charting platform by default
- Combines well with other indicators (MACD, volume)
- Backed by decades of market research and use
- Helps remove emotion from trading decisions
Cons
- Lagging indicator (reacts to price, does not predict)
- Can stay overbought/oversold for extended periods
- Produces false signals in strong trending markets
- Less reliable on low-volume assets and meme coins
- Requires additional confirmation for best results
- Default settings may not be optimal for all crypto pairs
- Divergence signals can take time to play out
- News events can override RSI signals entirely
Advanced RSI Strategies for Crypto
Beyond the basics, there are several advanced RSI strategies that experienced crypto traders use. These techniques require more screen time and practice, but they can significantly improve your win rate.
The RSI trendline break is a technique where you draw trendlines directly on the RSI indicator, not the price chart. When the RSI breaks its own trendline, it often precedes a price breakout. This is because momentum shifts before price does. For example, if RSI has been making lower highs (forming a descending trendline on the RSI chart) and then breaks above that trendline, it signals that bullish momentum is returning even if the price has not broken out yet.
RSI range shift is another powerful concept. In a healthy uptrend, RSI tends to range between 40 and 80. In a downtrend, it ranges between 20 and 60. When you see RSI shift from the bearish range (20-60) to the bullish range (40-80), it confirms a trend change. This range shift often happens before the price chart gives a clear signal, making it a leading indicator of trend reversals.
Multi-timeframe RSI analysis involves checking RSI across at least two timeframes before entering a trade. For example, if you are planning a trade on the 4H chart, check the daily RSI first. If the daily RSI is in bullish territory (above 50) and the 4H RSI pulls back to oversold (below 30), you have a high-probability pullback entry in the direction of the larger trend. This technique dramatically reduces false signals.
The RSI failure swing is a specific pattern that Wilder himself identified as one of the strongest RSI signals. A bullish failure swing occurs when RSI falls below 30, bounces back above 30, pulls back but stays above 30, then breaks above its recent high. A bearish failure swing occurs when RSI rises above 70, drops below 70, rallies but stays below 70, then breaks below its recent low. These patterns signal that momentum has decisively shifted.
Setting Up RSI on Popular Platforms
Adding RSI to your chart is simple on all major platforms. On TradingView, click the "Indicators" button at the top of the chart, search for "RSI" or "Relative Strength Index," and click to add it. It will appear as a separate panel below your price chart. You can customize the period (default 14), the overbought level (default 70), and the oversold level (default 30) by clicking the settings gear icon on the indicator.
On Binance, navigate to the trading chart, click on "Technical Indicators" or the chart settings icon, and search for RSI. Binance uses TradingView charts by default, so the functionality is similar. On Bybit, the process is the same: open any trading pair's chart and add RSI from the indicator menu.
For mobile traders, both the TradingView app and exchange apps support RSI. On mobile, the RSI panel will be smaller, so consider increasing the line width for better visibility. Some traders also change the RSI color to make it stand out: green when above 50, red when below 50. This visual cue makes it faster to assess momentum direction at a glance.
Video: RSI Explained
Visual tutorial on using RSI for crypto trading.

Frequently Asked Questions
What is RSI in crypto trading?
RSI (Relative Strength Index) is a momentum oscillator that measures the speed and magnitude of price changes on a scale of 0 to 100. In crypto trading, it helps identify when a coin like Bitcoin or Ethereum is overbought (above 70) or oversold (below 30), giving traders clues about potential reversals or continuation of momentum.
What is a good RSI number for crypto?
There is no single "good" RSI number because context matters. Generally, RSI below 30 suggests a potential buying opportunity (oversold), while RSI above 70 suggests caution (overbought). An RSI around 50 indicates neutral momentum. For trend-following traders, staying in a trade while RSI remains above 40 in an uptrend is a common approach.
Is RSI 14 or RSI 9 better for crypto?
RSI 14 is better for most traders because it provides balanced signals with reasonable reliability. RSI 9 is better for short-term traders and scalpers who need faster signals and are willing to deal with more false signals. If you trade on the daily or 4H chart, stick with 14. If you scalp on the 5-minute or 15-minute chart, try RSI 9.
Can RSI predict crypto prices?
RSI does not predict prices. It measures momentum and identifies when that momentum reaches extreme levels. Think of it as a speedometer, not a GPS. It tells you how fast the market is moving in a direction, not where the price will go next. Use RSI as one input in your trading decision, not as a crystal ball.
What is RSI divergence in crypto?
RSI divergence occurs when the price and the RSI indicator move in opposite directions. Bullish divergence (price makes a lower low, RSI makes a higher low) suggests selling momentum is weakening and a bounce may come. Bearish divergence (price makes a higher high, RSI makes a lower high) suggests buying momentum is fading and a pullback may follow. Divergence is considered one of the most reliable RSI signals.
How do I combine RSI with MACD?
For a buy signal, look for RSI below 35 combined with a MACD bullish crossover. For a sell signal, look for RSI above 65 combined with a MACD bearish crossover. This dual-confirmation approach filters out many false signals that either indicator would produce alone. Both indicators are available on TradingView and all major exchange charts.
Does RSI work for altcoins or just Bitcoin?
RSI works for any liquid asset, including major altcoins like Ethereum, Solana, and XRP. However, its reliability decreases on very low-cap tokens with thin liquidity. For altcoins with at least $10 million in daily volume, RSI performs similarly to how it works on Bitcoin. For micro-caps and meme coins, use RSI with extra caution and always confirm with volume.
What timeframe is best for RSI in crypto?
The daily chart is the most reliable timeframe for RSI analysis. The 4-hour chart offers a good balance of signal frequency and reliability for swing traders. The 1-hour chart works for day traders but produces more false signals. The weekly chart is best for long-term investors identifying major cycle tops and bottoms.
Why does RSI stay overbought for so long during bull runs?
In strong trends, momentum is persistent. RSI measures momentum, so during a powerful bull run, buying pressure remains dominant for extended periods. The market keeps closing higher, keeping the average gains elevated relative to average losses. This is why RSI alone should never be used to short during a confirmed uptrend.
What is a failure swing in RSI?
A failure swing is a specific RSI pattern identified by its creator, J. Welles Wilder. A bullish failure swing occurs when RSI drops below 30, bounces, pulls back but stays above 30, then breaks its recent high. A bearish failure swing is the reverse above 70. These patterns are considered strong reversal signals because they show momentum failing to continue in the previous direction.
Can I use RSI for leverage trading in crypto?
Yes, many leverage traders use RSI as part of their strategy. However, because leverage amplifies both gains and losses, you should use stricter RSI thresholds (for example, waiting for RSI below 25 instead of 30 for longs) and always combine RSI with at least one additional confirmation signal. Never open a leveraged position based on RSI alone.
Is RSI enough on its own for trading decisions?
No. RSI should never be your only indicator. It was designed as one component of a broader analytical framework. The best results come from combining RSI with price action analysis, support and resistance levels, volume, and at least one other indicator like MACD or moving averages. If you are building your skills, start with our guide on how to read crypto charts to develop a well-rounded approach.
How do I backtest RSI strategies for crypto?
TradingView offers a strategy tester feature that lets you backtest RSI-based strategies using Pine Script. You can set rules like "buy when RSI crosses below 30 and sell when RSI crosses above 70" and see historical performance data. Many traders also use Python with libraries like pandas and ccxt to backtest RSI strategies against historical crypto data. Backtesting is essential before risking real capital on any RSI strategy.
What is the difference between RSI and Stochastic RSI?
Standard RSI measures the momentum of price changes, while Stochastic RSI applies the Stochastic formula to RSI values instead of price. This makes Stochastic RSI more sensitive and faster to react. Stochastic RSI oscillates between 0 and 1 (or 0 and 100) and reaches overbought and oversold extremes more frequently. Some traders prefer Stochastic RSI for short-term trading because of its increased sensitivity, while standard RSI remains preferred for swing trading and position trading.
Related Guides
- What Is Technical Analysis in Crypto Trading: Complete Beginner Guide (2026)
- How to Use RSI in Crypto Trading: Strategy 2026
- What Is RSI Divergence in Crypto Trading? 2026 Guide
- What Is the Crypto Fear and Greed Index: Complete Trader Guide (2026)
- What Is a Crypto Index Fund? Investor Guide (2026)
- What Is the Money Flow Index (MFI) in Crypto Trading? (2026)