What Is the Money Flow Index (MFI) in Crypto Trading? (2026)
— By Tony Rabbit in Tutorials
Learn what the Money Flow Index (MFI) is in crypto trading, how this volume-weighted RSI works, and how to use it for spotting overbought/oversold conditio
What Is the Money Flow Index (MFI)?
The Money Flow Index (MFI) is a momentum oscillator used in technical analysis that helps traders understand buying and selling pressure. It operates on a scale from 0 to 100.
Often referred to as a 'volume-weighted RSI,' the MFI uniquely incorporates both price and volume data. This combination allows it to provide a more comprehensive view of an asset's momentum compared to indicators that only consider price.
How Is the MFI Calculated?
The MFI calculation involves several steps, combining typical price (high, low, close) with volume to determine 'money flow.' This money flow is then categorized into positive and negative money flow based on price movements.
The default lookback period for the MFI is 14. This means it considers the price and volume data over the past 14 periods (e.g., 14 days, 14 hours) to generate its current reading.
Interpreting MFI Signals: Overbought and Oversold
MFI readings provide insights into potential market conditions:
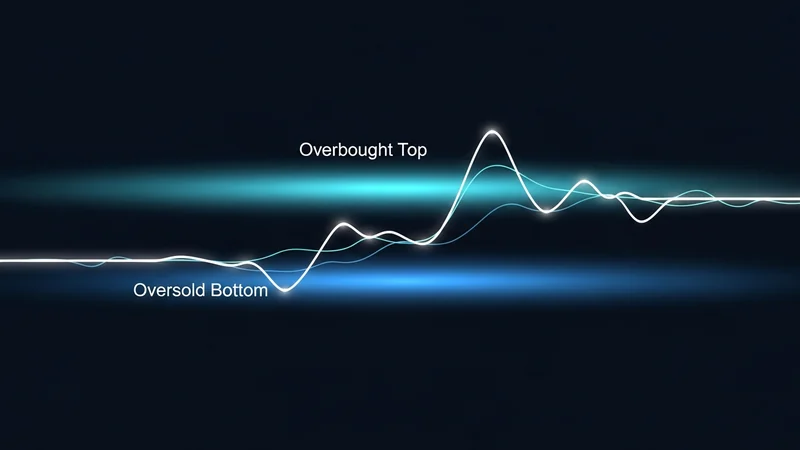
- Readings above 80 are generally considered overbought. This suggests that the asset may have been bought too aggressively and could be due for a price correction or reversal.
- Readings below 20 are generally considered oversold. This indicates that the asset may have been sold off too heavily and could be poised for a bounce or reversal upwards.
It's important to note that these thresholds are general guidelines and not definitive signals for immediate action.
Spotting Divergence with MFI
Divergence between the MFI and price can be a powerful warning sign. It occurs when the price of an asset moves in one direction, but the MFI moves in the opposite direction.
- Bearish Divergence: If the price makes a higher high, but the MFI makes a lower high, it can signal a weakening upward move and a potential bearish reversal.
- Bullish Divergence: If the price makes a lower low, but the MFI makes a higher low, it can suggest a weakening downward move and a potential bullish reversal.
These divergences indicate that the underlying buying or selling pressure is not supporting the current price trend.
How to Use MFI in Your Trading Strategy
Using the MFI effectively involves combining it with other analysis tools and considering the broader market trend. Here's a basic approach:
- Identify Trend. First, determine the prevailing trend of the crypto asset using other indicators or price action analysis.
- Spot Overbought/Oversold. Look for MFI readings above 80 (overbought) or below 20 (oversold) on your DEXTools chart.
- Look for Divergence. Check for divergences between the MFI and the asset's price, as these can warn of potential trend reversals.
- Confirm with Other Tools. Do not rely solely on MFI. Confirm potential signals with other technical indicators like support/resistance levels, moving averages, or candlestick patterns.
- Plan Your Trade. If multiple indicators align, consider your entry and exit points, and always manage your risk.
MFI vs. RSI: A Comparison
While often compared to the Relative Strength Index (RSI), the MFI adds a crucial dimension:
Limitations and Confirmation
Like all technical indicators, the MFI has limitations. In strong trends, an asset can remain in overbought or oversold territory for extended periods without an immediate reversal.

Tips for Using MFI Effectively
- Combine with Trend Analysis: Use MFI to identify potential entry or exit points within an established trend. For example, in an uptrend, look for MFI to dip into oversold territory as a potential buying opportunity.
- Multiple Timeframes: Check MFI readings across different timeframes (e.g., 1-hour, 4-hour, daily) to gain a broader perspective and confirm signals.
- Practice: The best way to understand MFI is to practice identifying its signals and divergences on historical charts.
Frequently Asked Questions
What does MFI stand for?
MFI stands for Money Flow Index, a technical indicator that measures buying and selling pressure using both price and volume.
What is a good MFI reading?
There isn't a single 'good' MFI reading; rather, readings above 80 are generally considered overbought, and below 20 are considered oversold, indicating potential reversals.
How is MFI different from RSI?
The MFI differs from the RSI by incorporating volume into its calculation, making it a volume-weighted oscillator, whereas the RSI only uses price data.
Can MFI predict future price movements?
No single indicator, including MFI, can predict future price movements with certainty. It provides probabilities and insights into market momentum and potential shifts, which should be confirmed with other analysis tools.
What is the default lookback period for MFI?
The default lookback period for the Money Flow Index (MFI) is 14 periods.