Dollar-Cost Averaging Crypto: A Data-Driven Guide
— By AliceOnChain in Tutorials

Market volatility can disrupt even the most calculated trading plans. Discover how to build an advanced dollar-cost averaging crypto strategy backed by liquidity analysis, holder distribution, and on-chain indicators.
SEO TITLE Dollar-Cost Averaging Crypto: A Data-Driven Guide
META DESCRIPTION Learn how to implement a dollar-cost averaging crypto strategy using on-chain data, liquidity metrics, and technical analysis to manage volatility.
FOCUS KEYWORD dollar cost averaging crypto
SECONDARY KEYWORDS crypto DCA strategy, on-chain analysis DeFi, managing market volatility, DEXTools pair explorer, crypto risk management
URL SLUG dollar-cost-averaging-crypto-guide
TAGS DeFi, Trading Strategies, Risk Management, On-Chain Analysis, Dollar-Cost Averaging
EXCERPT Market volatility can disrupt even the most calculated trading plans. Discover how to build an advanced dollar-cost averaging crypto strategy backed by liquidity analysis, holder distribution, and on-chain indicators.
Dollar-Cost Averaging (DCA) Explained: How to Set It Up
Navigating decentralized finance (DeFi) requires balancing high-yield opportunities against significant market volatility. For many market participants, attempting to time local bottoms or absolute peaks introduces emotional bias and execution risks, which is why utilizing a systematic dollar cost averaging crypto framework is widely favored over lump-sum allocations. This is particularly evident in low-to-medium liquidity pools where sudden capital shifts can cause dramatic price fluctuations. When combined with on-chain data analysis, a structured accumulation approach can help market participants manage volatility, build positions in high-conviction assets, and reduce the impact of short-term speculative noise.
Understanding Dollar-Cost Averaging in DeFi
At its core, a dollar cost averaging crypto framework involves dividing a total target capital allocation into smaller, periodic purchases executed at fixed intervals, regardless of the asset's spot price. The primary objective is to lower the average cost basis of a position over time, shifting the focus from short-term timing to long-term structural accumulation.
In traditional finance, DCA is often treated as a passive, set-and-forget mechanism. However, within decentralized markets, a passive approach can expose capital to structural vulnerabilities such as systemic liquidity drainage or exploitative smart contract risks. An effective DeFi accumulation strategy requires a deep understanding of underlying on-chain mechanics rather than just blind scheduling.
The Mathematics of Mitigating Volatility
When an asset undergoes a sharp correction, a fixed-fiat allocation automatically purchases a larger quantity of tokens. Conversely, when the asset experiences a rapid appreciation, the same fixed allocation purchases fewer tokens. Over an extended observation window, this distribution mathematically smoothens the entry price compared to a single, arbitrary entry.
This approach is highly relevant in decentralized environments where micro-cap assets or newly launched pairs exhibit extreme price discovery phases. By spreading out entries, market participants avoid deploying capital entirely at a structural resistance point or during a temporary, whale-induced liquidity pump.
Integrating On-Chain Analysis Into Your DCA Framework
An optimized strategy should not be executed in isolation from market data. Utilizing on-chain indicators allows market participants to refine their accumulation windows, identifying periods when an asset may be fundamentally undervalued or structurally overextended.
Evaluating Pool Liquidity and Volume
Before initiating a periodic accumulation plan for any decentralized pair, analyzing pool architecture is essential. High nominal price action can sometimes mask underlying fragile conditions.
Liquidity Tracking: Utilizing tools like the DEXTools Pair Explorer helps confirm whether a pair has deep, locked liquidity or if the liquidity-to-market-cap ratio is disproportionately low. Low liquidity relative to valuation implies that even small sell orders can trigger cascading price drops, impacting your average entry basis.
Volume Analysis: Consistent trading volume relative to liquidity indicates sustained organic interest. A sudden drop in volume alongside stagnant price action can signal fading market participants, suggesting it might be prudent to pause or re-evaluate the parameters of your dollar cost averaging crypto plan.
Assessing Holder Distribution and Whale Activity
Understanding who controls the supply of an asset provides critical context for long-term accumulation.
Holder Analysis and Concentration: Evaluating token distribution across wallets helps determine if a project is highly centralized. If a small percentage of addresses controls a dominant share of the circulating supply, the asset remains exposed to sudden, severe downside volatility if a single entity decides to divest.
Whale Activity Adjustments: Monitoring large-scale transfers or wallet cluster connections via integrated Bubblemaps can reveal underlying distribution trends. If top addresses are systematically distributing tokens into the market, initiating an accumulation phase during that specific window carries elevated risk, as structural selling pressure can depress prices for an extended period.
Technical Indicators for Optimized Accumulation
While pure DCA relies on strict adherence to a schedule, advanced market participants often utilize broad technical parameters to dynamically adjust the scale of their allocations. This approach, sometimes called "smart DCA," allows for larger relative purchases during historical macro valuation bottoms and smaller purchases during periods of extreme euphoria.
Support, Resistance, and Key Zones
Identifying established support and resistance levels helps establish realistic parameters for your entries.
Support Zones: These represent historical price levels where buying interest has previously shown enough strength to overcome selling pressure. Aligning a scheduled purchase near an established on-chain support zone can improve structural entry efficiency.
Resistance Zones: Conversely, scheduled purchases occurring directly beneath major multi-week resistance levels face an increased probability of short-term rejection, which may justify modulating the allocation size downward for that specific period.
Utilizing RSI Divergence and Market Sentiment
The Relative Strength Index (RSI) serves as a momentum oscillator that measures the speed and change of price movements.
Bullish RSI Divergence: This phenomenon occurs when the price of an asset prints a lower low, but the RSI indicator records a higher low. On longer timeframes, such as daily or weekly charts, a bullish divergence often signals that selling momentum is exhausting, which may indicate an opportunistic phase to sustain or slightly accelerate your allocations.
Bearish Overextension: When macro market sentiment pushes the RSI into deeply overbought territory (typically above 70 or 80) across daily charts, it suggests the asset is experiencing short-term overextension, indicating that a cooling-off period or correction may be probabilistic.
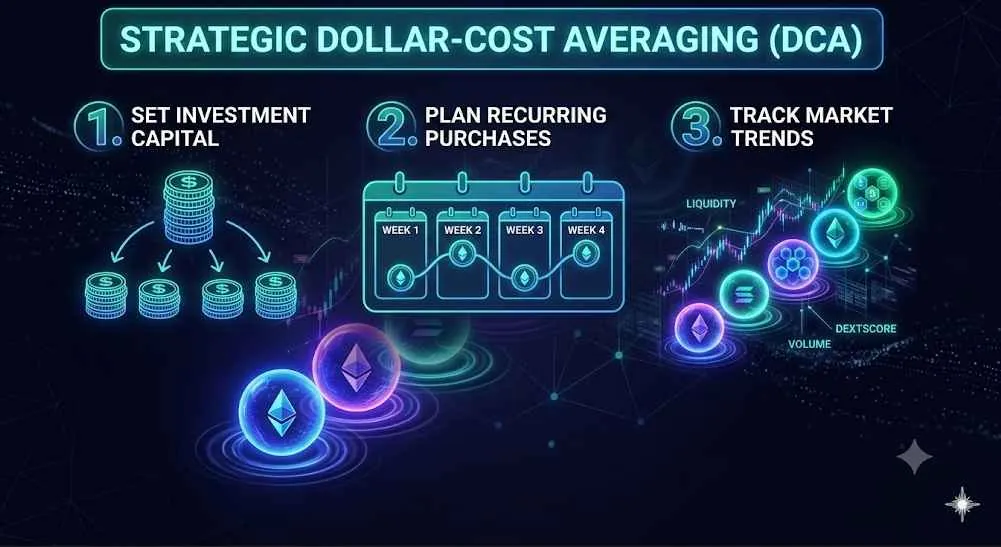
Step-by-Step Guide: Setting Up an Advanced DCA Plan
Implementing a structured plan requires defining clear parameters before deploying any capital into decentralized smart contracts.
Step 1: Define Total Capital and Interval Frequency
Determine your exact capital allocation from your overall risk capital. This should be an amount that does not compromise your financial stability if the market undergoes a prolonged downturn. Divide this capital into equal parts based on a preferred cadence, such as weekly, bi-weekly, or monthly intervals.
Step 2: Conduct Initial On-Chain Vetting
Before executing the first transaction, input the asset's contract address into the DEXTools search interface to review the pair's overall health metrics. Verify the DEXTScore to gauge the contract's reliability parameters and ensure there are no unverified or suspicious functions within the smart contract code. Review the total liquidity to confirm the market can absorb your planned order sizes without inducing high slippage.
Step 3: Monitor with Price Alerts and Custom Dashboards
To eliminate the need for constant screen monitoring, configure automated Price Alerts within your data interface. Setting alerts near key historical support zones or moving averages can notify you when conditions are highly favorable for your systematic intervals.
Step 4: Track Top Traders and Wallet Behavior
Analyze the smart contract's transaction ledger using the Top Traders and live transaction features. Observing whether profitable historic wallets are accumulating, holding, or distributing provides real-time sentiment data that can validate whether your selected accumulation target maintains long-term structural validity.
Volatility Management and Risk Controls
Even a well-structured dollar cost averaging crypto strategy can result in capital depreciation if proper risk controls are neglected. Volatility is a defining characteristic of decentralized markets, and managing it requires disciplined adherence to specific parameters.
Rebalancing and Evaluating Project Fundamentals
An accumulation strategy should never be entirely static. If a project's core metrics shift significantly—such as a permanent migration of liquidity to an unlinked pool, a core developer departure, or structural modifications to tokenomics—the fundamental thesis changes. Periodically reviewing the on-chain health metrics ensures that capital is not continuously deployed into a structurally decaying asset.
The Pitfall of "Catching a Falling Knife"
There is an analytical distinction between systematic accumulation during an expected market-wide correction and adding capital to a single asset undergoing an isolated, fundamental collapse. If an asset's price declines rapidly alongside a catastrophic drop in total locked liquidity and a mass exodus of unique holders, continuing to execute automated purchases under the assumption that it will eventually recover represents a severe risk.
Summary of Best Practices for Crypto DCA
A successful dollar cost averaging crypto framework relies on consistency, data tracking, and emotional detachment from short-term market fluctuations. By utilizing comprehensive on-chain metrics, market participants can transition from speculative trading to systematic asset accumulation.
Establish Fixed Parameters: Define your investment capital, interval frequency, and target assets clearly prior to deployment.
Prioritize High Liquidity: Focus your systematic accumulation on pairs with deep, verifiable liquidity pools to minimize slippage and structural risks.
Monitor Distribution Trends: Regularly audit holder concentration and whale movements to ensure the token supply remains healthy and decentralized.
Incorporate Momentum Data: Use high-timeframe technical indicators, such as support zones and RSI readings, to gain clear context on broader market cycles.
DEXTools Pair Explorer for Early Liquidity Signals
How to Read On-Chain Data: Metrics, Wallet Flows and Dashboards
7 On-Chain Data Signals That Help Identify High-Growth Crypto Assets
Disclaimer: This article is for informational purposes only and does not constitute investment advice, financial advice, trading advice, or any other kind of advice. DEXTools does not recommend buying, selling, or holding any cryptocurrency or token. Users should conduct their own research and consult with a qualified financial advisor before making any investment decisions. Cryptocurrency investments are volatile and high-risk. DEXTools is not responsible for any losses incurred.