Gravestone Doji and Dragonfly Doji

When open and close prices converge perfectly, the market prints a critical decision boundary. We deconstruct the mechanics of trading Gravestone and Dragonfly Doji setups.
Trading Doji Reversals
- In the microstructure of candlestick charting, the real body of a candle maps the final net progress achieved by buyers or sellers within a specific time window. When a candlestick prints a wide, heavy real body, it signals clear directional dominance. However, some of the most critical turning points in the market manifest when the real body completely disappears. This architectural phenomenon is known as a Doji.
- A Doji occurs when the opening price and closing price of a trading session are virtually identical. This convergence creates a visual cross or dash on the chart, signaling total equilibrium and intense supply-and-demand friction.
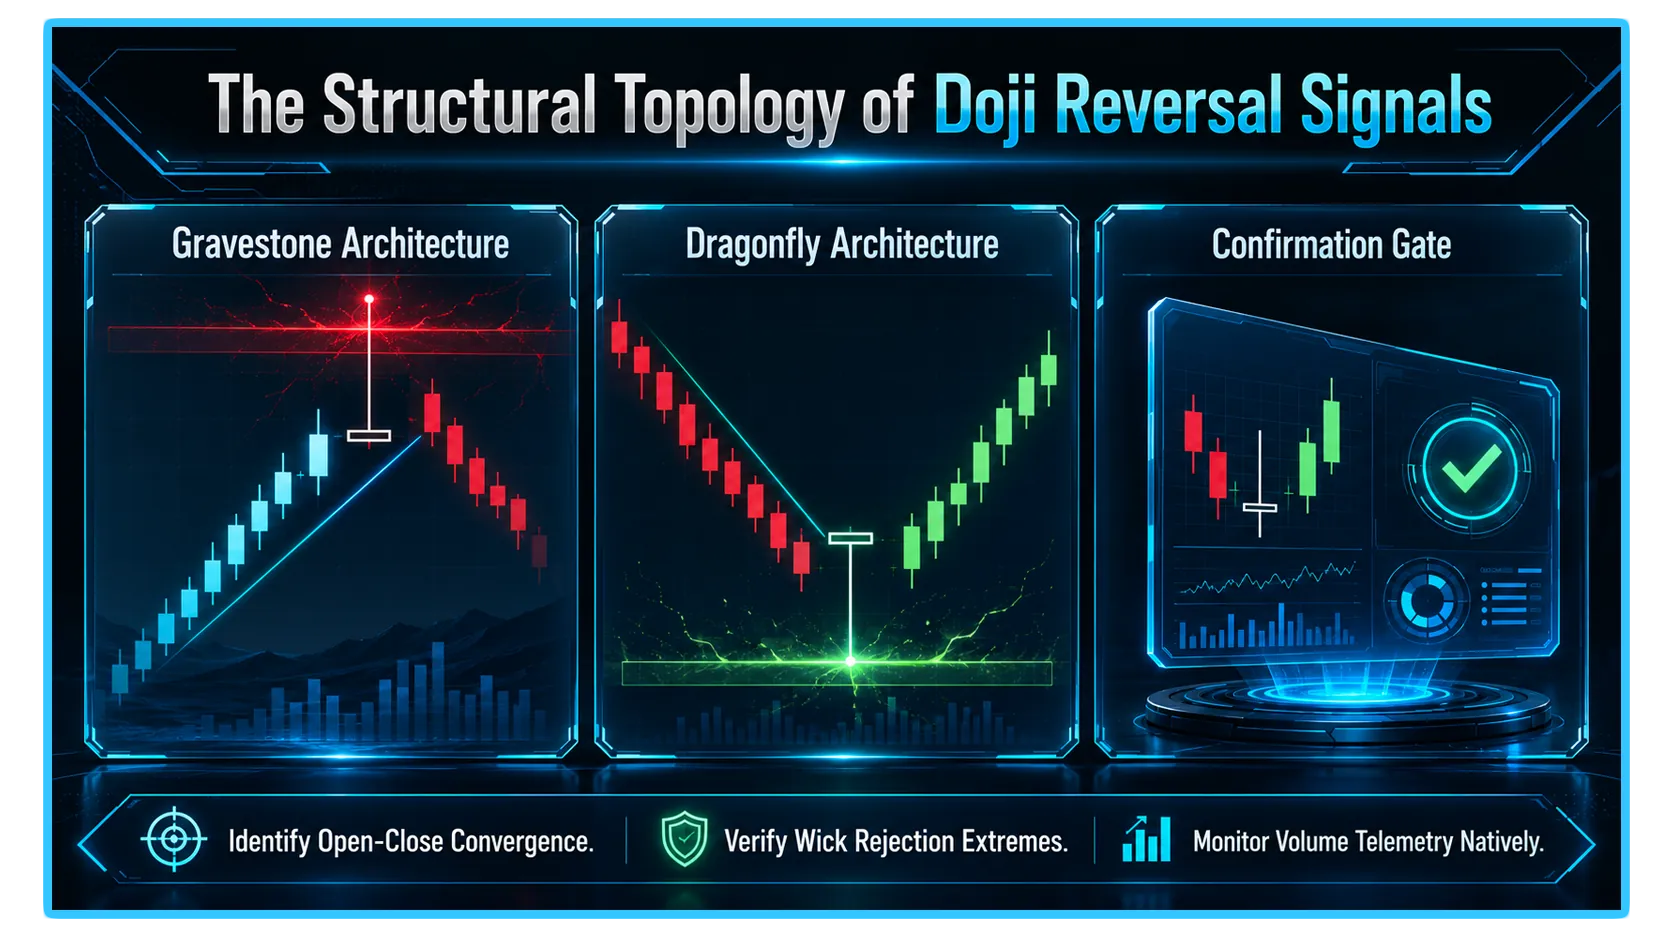
- When this open-close convergence occurs at the extreme edges of a session's trading range, it creates two highly predictive structural variants: the Gravestone Doji and the Dragonfly Doji. Mastering these setups allows traders to identify when an overextended market trend is exhausting its capital reserves and preparing for an aggressive reversal.
1. The Gravestone Doji: Bearish Rejection at the Peaks
The Gravestone Doji is a stark bearish reversal signature that materializes at the top of an extended bullish uptrend or within known institutional supply zones. Visually, it features a long upper wick or shadow, while the opening, closing, and low prices are clustered tightly together at the absolute bottom of the session.
The operational journey of a Gravestone Doji exposes a massive structural trap for retail breakout buyers:
The Initial Push: Upon the session open, buyers maintain aggressive control, driving the price upward to establish a localized high.
The Institutional Counter-Attack: At the peak of the expansion, the asset collides with heavy institutional sell limit orders or active profit-taking. Sellers completely overwhelm the buying momentum, driving the price all the way back down to the session's opening baseline.
The Structural Result: By closing at the absolute lows, the market leaves behind a long upper wick. This tells an unmistakable story: every single bit of intraday buying pressure was completely erased, leaving breakout buyers trapped in losing positions.
2. The Dragonfly Doji: Bullish Absorption at the Floors
The Dragonfly Doji functions as the exact structural mirror image of the gravestone. Materializing at the valley of a prolonged bearish markdown phase or directly against a major historical support floor, this formation signals that the downward momentum has officially dried up.
The internal order flow dynamics of a Dragonfly Doji unfold through a classic accumulation sequence:
The Panic Flush: The session opens, and short-sellers aggressively push the asset downward, attempting to force a structural breakdown and trigger retail stop-losses.
The Liquidity Capture: At the absolute lows of the flush, the asset targets a deep pocket of institutional buy orders. Aggressive buyers step in, absorbing the liquidations and driving the price all the way back up to the session's opening print.
The Structural Result: The candle closes at its absolute high, leaving a long lower wick. This structure proves that the bears failed to defend their breakdown, and the buy-side has successfully reclaimed control of the immediate market boundary.
3. The Comparison Grid: Mapping Doji Profiles
To maintain absolute clarity when categorizing these structural boundaries on your active charting interfaces, analyze the distinct operational properties of these two doji variants:
| Doji Attribute | Performance Profile |
| Gravestone Trigger | Signals bearish rejection at peaks |
| Dragonfly Trigger | Signals bullish absorption at floors |
| Confirmation Rule | Demands matching next-candle close |
4. The Complete Execution Blueprint: Trading Doji Reversals
Attempting to trade a Gravestone or Dragonfly Doji the exact second it prints exposes your capital to unnecessary execution risk. Because a doji represents an equilibrium point, entering a position without waiting for the market to choose its next direction can trap you in an active expansion continuation. Disciplined trading requires waiting for formal validation on the subsequent candle.
The Bearish Doji Strategy (Trading the Gravestone)
The Setup: Locate a distinct Gravestone Doji forming at a prominent higher-timeframe resistance zone or after a prolonged upward move.
The Confirmation Gate: Wait for the next candlestick session to finalize. To confirm the reversal, this subsequent candle must close as a solid bearish bar below the low of the Gravestone Doji's real body.
The Entry and Risk Plan: Open a short position at the exact close of that confirmation candle. Position your protective stop-loss slightly above the absolute peak of the Gravestone's long upper wick. Target the nearest unmitigated structural support box or range equilibrium point.
The Bullish Doji Strategy (Trading the Dragonfly)
The Setup: Isolate a clean Dragonfly Doji printing at a clear historical liquidity floor or key demand block.
The Confirmation Gate: Monitor the next candle session. The pattern is validated only if this next candle closes as a robust bullish bar above the top of the Dragonfly Doji's real body.
The Entry and Risk Plan: Execute a long position at the precise close of the confirmation candle. Place your protective stop-loss safely below the absolute lowest tip of the Dragonfly's lower wick. Set your profit targets at the opposing structural swing highs or unmitigated supply zones.
5. Real-Time Telemetry and Market Diagnostics via DEXTools
- Formulating a flawless execution framework built on Doji reversals requires access to look-through, live data telemetry. While historical candlesticks display past price matching, evaluating real-time transaction velocity, order book depth imbalances, and localized volume distributions on decentralized venues is the only method to confirm if a doji wick represents a genuine institutional liquidity sweep or merely low-volume market drift.
- DEXTools provides the critical analytical data infrastructure needed to monitor these on-chain movements in real-time. By utilizing advanced pair tracking, live buy/sell transaction logs, and cross-chain wallet telemetry across alternative layer ecosystems, market participants can independently verify if an emerging Gravestone or Dragonfly Doji is backed by authentic, large-scale whale wallet accumulation.
- Cross-referencing your candlestick indicators with live market telemetry ensures your entry models remain highly effective, allowing you to identify real market turning points safely while keeping your capital optimized.
Disclaimer: This article is for informational purposes only and does not constitute investment advice, financial advice, trading advice, or any other kind of advice. DEXTools does not recommend buying, selling, or holding any cryptocurrency or token. Users should conduct their own research and consult with a qualified financial advisor before making any investment decisions. Cryptocurrency investments are volatile and high-risk. DEXTools is not responsible for any losses incurred.