NUPL and SOPR Explained: Top Crypto Profit/Loss Indicators
— By AliceOnChain in Tutorials

Discover how Net Unrealized Profit/Loss (NUPL) and Spent Output Profit Ratio (SOPR) read investor psychology directly from the blockchain to help you navigate market volatility.
NUPL and SOPR Explained: How to Read On-Chain Profit and Loss Indicators
Market sentiment in the cryptocurrency landscape can shift rapidly, often leaving traders searching for objective metrics amid the noise of social media and daily price action. While traditional technical analysis focuses on price and volume patterns, blockchain technology offers a distinct alternative: transparent, auditable transactional data. Evaluating data sets like nupl sopr allows market participants to look beneath the surface of price charts to assess investor psychology, whale activity, and holder distribution based on actual on-chain cost basis data.
Understanding these on-chain metrics can help intermediate traders manage risk and understand market cycles with greater clarity.
The Fundamentals of On-Chain Cost Basis
To understand the core relationship behind nupl sopr dynamics, it is necessary to first understand how the blockchain tracks value. Unlike traditional account-based systems, networks like Bitcoin use the Unspent Transaction Output (UTXO) model. Every time a cryptocurrency moves, the blockchain records the exact price at the time of that transfer. This creates a permanent record of the "realized price" or the cost basis for that specific asset.
By comparing the current market price against the realized price of all tokens across the network, on-chain analysts can determine whether the market as a whole is sitting on profits or losses. This distinction between paper wealth (unrealized) and locked-in value (realized) forms the backbone of advanced sentiment analysis.
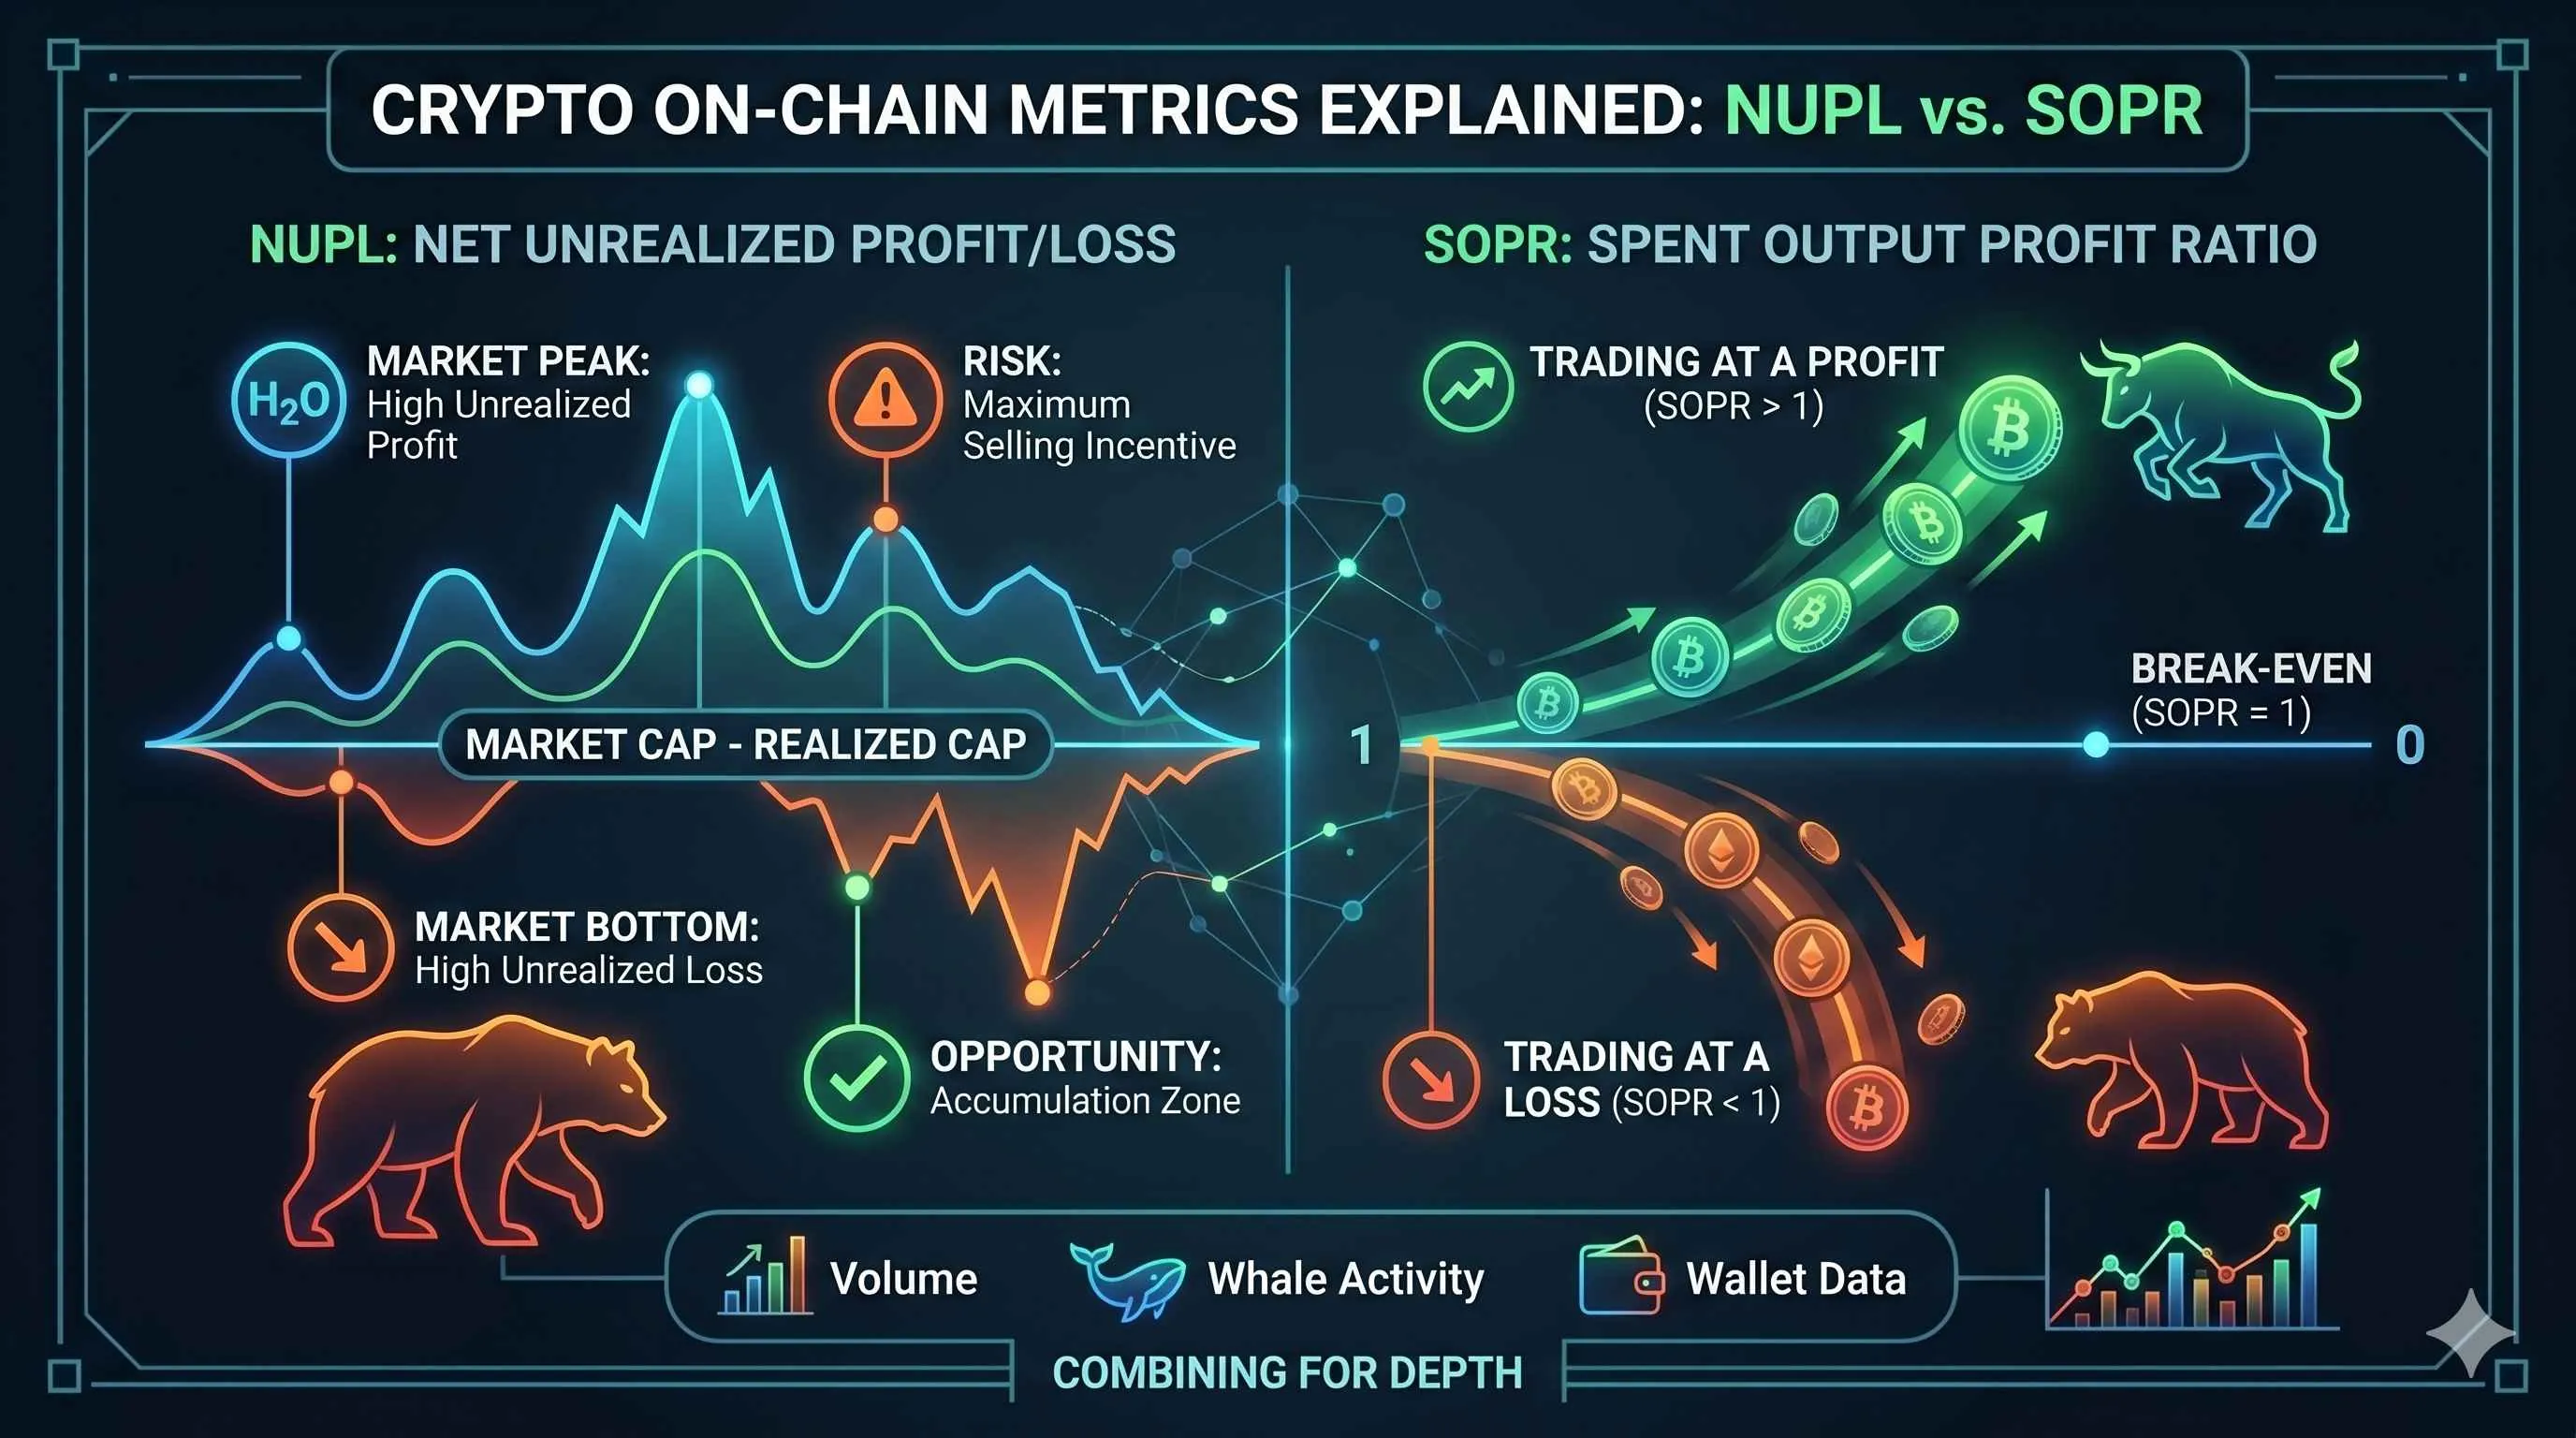
What is Net Unrealized Profit/Loss (NUPL)?
Net Unrealized Profit/Loss (NUPL) measures the total amount of profit or loss locked within the network's outstanding supply. It calculates the difference between Relative Unrealized Profit and Relative Unrealized Loss.
The mathematical relationship can be stated simply:
Market Cap: The current value of the circulating supply based on the spot price.
Realized Cap: The cumulative value of the supply based on the price when each token last moved.
When you subtract the Realized Cap from the Market Cap and divide the result by the Market Cap, you get the NUPL ratio.
Interpreting NUPL Values and Sentiment
NUPL values fluctuate between negative numbers and positive numbers, typically bound between -1 and +1. These values correspond directly to macro market phases:
Values Below 0 (Capitulation): The average holder is underwater. Historically, this environment occurs during the deepest phases of a bear market, where fear dominates and panic selling is common.
Values Between 0 and 0.25 (Hope / Fear): The market enters a transition phase. Price action may consolidate as the network edges back into slight profitability.
Values Between 0.25 and 0.50 (Optimism / Anxiety): A sustained uptrend often pushes NUPL into this zone. Holders generally see moderate gains, but capital has not yet reached extreme overvaluation.
Values Between 0.50 and 0.75 (Belief / Denial): This level indicates strong structural conviction. Pullbacks within this range are frequently viewed by participants as buying opportunities rather than trend reversals.
Values Above 0.75 (Euphoria): The vast majority of the network supply is in profit. Historically, this level signals macroeconomic cycle tops, where the incentive for large-scale distribution increases significantly.
What is Spent Output Profit Ratio (SOPR)?
While NUPL tracks the aggregate paper wealth of the network, the Spent Output Profit Ratio (SOPR) monitors the actual behavior of spent assets. It measures the economic output of transactions moving on-chain over a specific timeframe.
SOPR is calculated by dividing the USD value of a spent output at the time of its creation by its USD value at the time of its initial acquisition. In simpler terms: Sell Price / Buy Price.
The Significance of the Baseline (SOPR = 1)
The number 1 is the critical pivot point for SOPR analysis:
SOPR Greater Than 1: On average, the coins moving on-chain are being spent at a profit.
SOPR Less Than 1: On average, capital is moving at a loss, indicating that holders are selling assets for less than they paid for them.
SOPR Equal to 1: The market is breaking even.
During a structural bull market, the SOPR line often acts as a psychological support level. When price drops, SOPR declines toward 1. This happens because investors tend to resist selling at a loss when they believe the broader trend is positive. If the ratio bounces off 1, it demonstrates that the market is rejecting lower prices, suggesting strong support.
Conversely, in a bear market, SOPR struggles to break above 1. Rallies toward the break-even line are met with selling pressure by investors eager to exit their positions without incurring a loss, turning the number 1 into an on-chain resistance zone.
Integrating NUPL and SOPR into Your Analysis Framework
Relying on a single metric can create blind spots. Sophisticated market participants use NUPL to identify the macro economic trend and SOPR to time execution points or identify sudden structural shifts.
Step 1: Establish the Macro Regime with NUPL
Begin by assessing the broader market cycle. If NUPL is rising from 0.25 toward 0.60, the market is structurally sound and entering an expansionary phase. During these windows, short-term volatility is expected, but the broader trend remains upward. If NUPL climbs past 0.75, it signals a high-risk environment where capital preservation should take priority over aggressive accumulation.
Step 2: Track Execution Zones and Short-Term Behavior via SOPR
Once the macro trend is established, use SOPR to evaluate shorter-term market corrections. In an ongoing uptrend, wait for price drawdowns that pull SOPR down to or slightly below 1. If selling dries up at this level and the metric moves back above 1, it implies that panicking retail participants have completed their distribution, leaving the asset supply in firmer hands.
Step 3: Identify Divergences with Traditional Technical Metrics
To increase structural accuracy, cross-reference these on-chain metrics with traditional technical tools available on platforms like DEXTools. For instance, if price action is printing higher highs on the daily chart but NUPL is showing a clear lower high, this represents an on-chain RSI divergence. It reveals that while the nominal price is climbing, the underlying network-wide profitability is slowing down—a classic sign of weakening buyer momentum.
Advanced Data Validation and On-Chain Confluences
To prevent false signals, experienced analysts combine macro indicators like nupl sopr with micro data points directly from decentralized exchanges and on-chain intelligence dashboards.
Monitoring Liquidity and Volume Dynamics
High NUPL levels are far more dangerous when accompanied by declining on-chain liquidity and trading volume. If profitability is at extremes but liquidity tracking tools reveal thin market depth in liquidity pools, a sudden wave of whale distribution can trigger severe cascading price drops.
Traders should monitor live order books, liquidity pools, and trading volumes using the DEXTools Pair Explorer. If you notice a high-profitability environment paired with drying liquidity on decentralized venues, it represents an ideal environment for localized volatility.
Whale Activity and Holder Distribution Analysis
A macro metric like SOPR tells you if profit-taking is occurring, but it doesn't specify who is driving the activity. By cross-referencing SOPR spikes with wallet data, you can isolate systemic moves.
Using the Holder Analysis and Bubblemaps features on DEXTools allows traders to map out wallet clusters and track large holder distributions in real time. If a SOPR spike coincides with a significant reduction in whale wallet balances, it strongly suggests that institutional or early-stage capital is executing an exit strategy.
On the other hand, if a SOPR dip below 1 is driven entirely by smaller, fragmented retail wallets while whale clusters remain stationary or accumulate, it indicates a standard shakeout rather than a macro trend reversal.
Volatility Management and Risk Tools
On-chain analysis is fundamentally probabilistic. Unexpected external macroeconomic factors can disrupt historical patterns instantly. Therefore, tracking these metrics should always be paired with defensive risk-management practices.
Utilizing automated tools like DEXTools Price Alerts allows you to establish strict invalidation levels based on key technical support zones. If SOPR breaks below the critical 1 line during a supposed bull market pullback, and price breaches a major horizontal support level on the chart simultaneously, your thesis must adapt to a potentially larger bearish shift.
Conclusion: A Data-Driven Approach to Crypto Markets
On-chain indicators like nupl sopr offer clear insights into market participants' behavior by replacing speculation with empirical spending data. NUPL allows you to track macro psychology and understand when the broader market is reaching extremes of euphoria or despair. SOPR supplements this by providing a transactional view of realized profits and losses, pointing out where structural support and resistance levels are forming.
However, these metrics should never be viewed in isolation. True accuracy comes from combining macro on-chain trends with real-time liquidity analysis, volume tracking, and detailed holder distribution data. By building a comprehensive framework that balances on-chain insights with disciplined risk management, traders can navigate volatile cryptocurrency markets with greater clarity and confidence.
Realized Cap vs Market Cap: Advanced On-Chain GuideIs On-Chain Data Replacing Technical Analysis in Crypto?
How to Read On-Chain Data: Metrics, Wallet Flows and Dashboards
What Is UTXO in Crypto? Unspent Transaction Output Explained
Disclaimer: This article is for informational purposes only and does not constitute investment advice, financial advice, trading advice, or any other kind of advice. DEXTools does not recommend buying, selling, or holding any cryptocurrency or token. Users should conduct their own research and consult with a qualified financial advisor before making any investment decisions. Cryptocurrency investments are volatile and high-risk. DEXTools is not responsible for any losses incurred.