What Is a Bullish Engulfing Candlestick in Crypto Trading? 2026 Guide
— By Tony Rabbit in Tutorials
Learn how to read the bullish engulfing candlestick, one of the most watched reversal patterns in crypto trading, and how to confirm it with support and volume.
Candlestick patterns are one of the first things most crypto traders learn, and the bullish engulfing pattern is among the most recognized of them all. It is a simple two candle formation that signals a possible shift in momentum from sellers to buyers, and it shows up across every timeframe, from one minute charts to weekly views.
In this 2026 guide we break down exactly what a bullish engulfing candlestick is, how to spot it on a chart, why it matters in volatile crypto markets, and how to filter out weak setups using support levels and volume. We also cover its mirror image, the bearish engulfing, so you understand both sides of the trade. None of this is financial advice, and no pattern guarantees a future price.
What Is a Bullish Engulfing Candlestick?
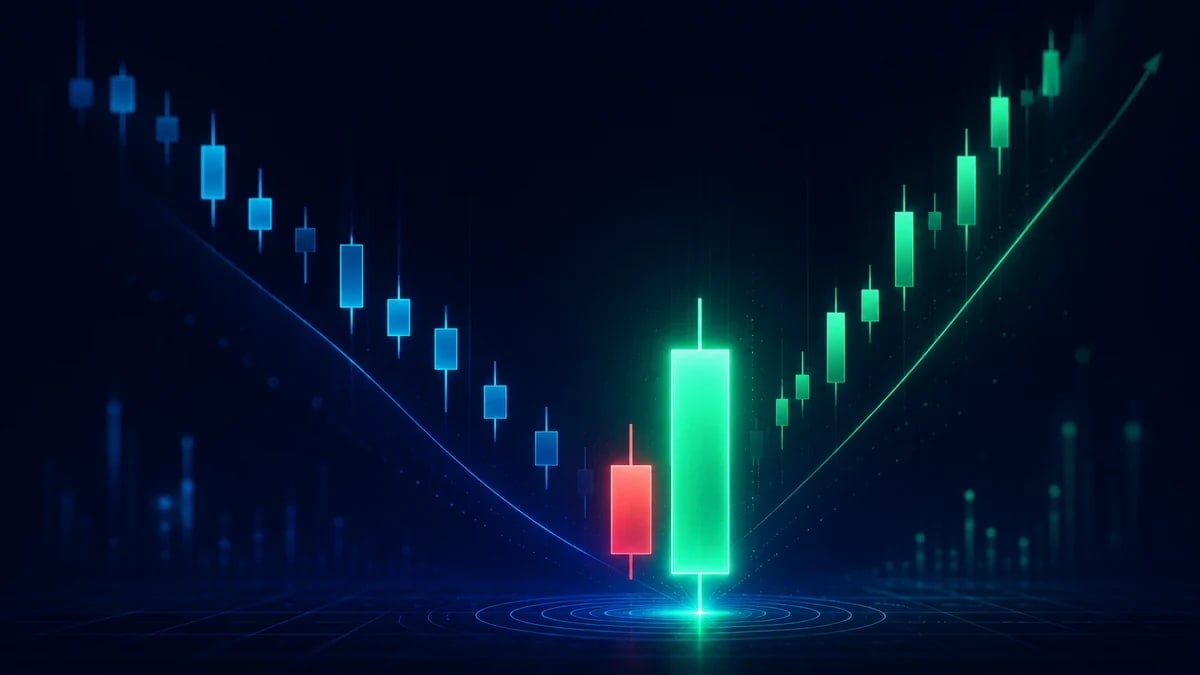
A bullish engulfing is a two candle bullish reversal pattern that forms at the bottom of a downtrend. The first candle is a small bearish candle, reflecting continued selling pressure. The second candle is a larger bullish candle whose body completely engulfs the body of the prior candle. In other words, the green body opens at or below the previous close and closes at or above the previous open, wrapping the earlier candle inside it.
The visual message is direct. In a single session, buyers stepped in with enough force to erase the prior session of selling and push the close well above where it began. That sudden shift in control is why the bullish engulfing is treated as a potential reversal signal rather than a continuation pattern.
Psychology sits at the heart of the pattern. The small first candle reflects a market still leaning bearish but losing conviction, while the large second candle reveals a wave of buyers stepping in with size. That contrast between hesitation and conviction, captured in just two candles, is what makes the formation such a quick read for traders scanning many charts at once.

How to Identify the Pattern on a Chart
Spotting a valid bullish engulfing comes down to a short checklist. Run through these conditions before you treat a setup as the real thing.
The Core Conditions
- The market is in a clear downtrend, with lower highs and lower lows leading into the pattern.
- The first candle is bearish (red), usually with a small body.
- The second candle is bullish (green) and larger than the first.
- The green body fully engulfs the red body, opening at or below the prior close and closing at or above the prior open.
Traders usually focus on the candle bodies rather than the wicks. Some stricter definitions ask the wicks to be engulfed as well, but the body to body relationship is the version most analysts watch. The bigger the second candle relative to the first, the more decisive the shift in sentiment appears to be.
Why the Bullish Engulfing Matters in Crypto
Crypto markets move fast and trade around the clock, which makes momentum shifts more pronounced than in many traditional markets. When sentiment flips, it can flip hard. A bullish engulfing candle captures that moment of change in a way that is easy to read at a glance, which is part of why it remains one of the most watched reversal signals among both new and experienced traders.
It also gives structure to a chart that might otherwise look like noise. Instead of guessing where buyers might return, the pattern marks a specific point where demand visibly overwhelmed supply. That clarity helps traders define entries, stops, and targets with reference to an actual price event rather than a feeling. Charting platforms such as DEXTools make it straightforward to scan token charts across timeframes and look for these formations as they develop.
Confirmation: How to Filter Out Weak Signals
On its own, a single bullish engulfing candle is not a guarantee. Plenty of them fail, especially in choppy or low liquidity conditions. The pattern becomes far more reliable when several supporting factors line up at the same time.

Context That Strengthens the Setup
- Support levels. A bullish engulfing that forms right at a known support zone or a prior demand area carries more weight than one floating in the middle of nowhere.
- Volume. High volume on the engulfing candle suggests real participation behind the move, not just a thin wick fueled by a few orders.
- A clear downtrend. The pattern is a reversal signal, so it needs something to reverse. After an extended decline, the shift carries more meaning.
- Confirmation candle. Many traders wait for the next candle to close higher before acting, treating the follow through as proof that buyers held control.
Combining the pattern with other tools, such as moving averages, the relative strength index, or trendlines, can further reduce false signals. The goal is confluence: several independent reasons pointing in the same direction at the same price.
The Bearish Engulfing: The Mirror Image
Every bullish pattern has an opposite, and the bearish engulfing is the mirror of the one we have been discussing. It forms at the top of an uptrend, where a small bullish candle is followed by a larger bearish candle whose body completely engulfs the prior one. The message is reversed: sellers overwhelmed buyers in a single session, hinting at a possible move lower.
The same confirmation logic applies in reverse. A bearish engulfing carries more weight when it appears at resistance, with strong volume, after a clear uptrend. Knowing both patterns helps you read momentum in either direction and avoid mistaking a topping signal for a buying opportunity.
Common Mistakes to Avoid
Even a well known pattern can lead traders astray when applied carelessly. Watch out for these frequent errors.
- Trading the pattern in a sideways range where there is no real trend to reverse.
- Ignoring volume and acting on a thin, low conviction candle.
- Skipping risk management and entering without a defined stop loss.
- Forcing the pattern by stretching the definition when the second body does not truly engulf the first.
- Acting on a low timeframe signal that conflicts with the higher timeframe trend.
Risk management remains the backbone of any approach. A stop placed below the low of the engulfing pattern gives the trade a clear invalidation point, so you know in advance where your idea is wrong and can exit without hesitation.
Conclusion
The bullish engulfing candlestick is a clean, intuitive way to spot a potential shift from selling to buying pressure at the bottom of a downtrend. Its strength comes not from the shape alone but from the context around it, namely support, volume, a genuine prior trend, and confirmation. Treat it as one input among several rather than a standalone signal, pair it with disciplined risk management, and remember that no pattern predicts the future. Used thoughtfully, it can be a valuable part of your crypto charting toolkit in 2026 and beyond.
Related Guides
- What Is an Evening Star Pattern in Crypto Trading? 2026 Guide
- What Is a Spinning Top Candlestick in Crypto Trading? 2026 Guide
- What Is a Shooting Star Candlestick in Crypto Trading? 2026 Guide
- What Is a Morning Star Pattern in Crypto Trading? 2026 Guide
- What Is a Harami Candlestick Pattern in Crypto Trading? 2026 Guide
Frequently Asked Questions
What is a bullish engulfing candlestick?
A bullish engulfing pattern is a two-candle formation where a larger up candle fully covers the body of the previous down candle. It is often read as a possible sign that buyers are taking control after a decline.
Is a bullish engulfing pattern always reliable?
No, no single candlestick pattern is reliable on its own, and false signals are common in volatile crypto markets. Traders usually look for confirmation from volume, trend context, or support levels before acting.
How do you confirm a bullish engulfing signal?
Common confirmation methods include higher trading volume on the engulfing candle, the pattern forming near a support area, and follow-through buying in the next candles. Combining signals can reduce the chance of acting on a false reversal.
Where does a bullish engulfing pattern carry more weight?
It is generally considered more meaningful when it appears after a clear downtrend or at a known support level rather than in the middle of choppy price action. Context matters because the pattern suggests a shift from selling to buying pressure.