What is APY vs APR in Crypto? With Real Examples
— By AliceOnChain in Tutorials

Navigating yield opportunities in decentralized finance requires a precise understanding of how your returns are calculated. This comprehensive guide breaks down the structural differences between APR and APY, provides real-world crypto examples, and explains how to look past misleading triple-digit metrics to preserve your capital.
Mastering DeFi Yields: A Deep Dive into APY and APR
Decentralized finance (DeFi) platforms offer capital-allocation strategies that are fundamentally driven by yield, making many market participants stop and ask: what is APY vs APR in crypto and how does the choice between them alter overall investment returns? Whether you are providing liquidity to an Automated Market Maker (AMM), staking governance tokens, or participating in decentralized lending protocols, you are constantly confronted with performance metrics designed to project your potential earnings. The two most prominent of these metrics are Annual Percentage Rate (APR) and Annual Percentage Yield (APY).
For many users entering the on-chain space, a common point of confusion is understanding exactly what distinguishes these two figures when evaluating different liquidity pools and yield farms. While they both measure annual returns over a 365-day horizon, they operate on fundamentally different mathematical mechanics. Misinterpreting these figures can lead to flawed risk assessments, overestimating potential gains, or miscalculating the true cost of capital in a multi-step trading strategy.
To trade and allocate capital effectively on-chain, you must learn to look past flashy headline percentages. This guide delivers a practical APY vs APR crypto differences breakdown, illustrates their mechanics with real-world DeFi scenarios, and demonstrates how to cross-examine yield-bearing environments using DEXTools to manage risk efficiently.
The Core Definitions: Simple vs. Compound Returns
The fundamental variance between these two financial metrics boils down to a single financial mechanism: compounding interest.
Annual Percentage Rate (APR) Explained
Annual Percentage Rate represents the simple interest rate earned on an investment or charged on a loan over the course of a single year. It does not account for the phenomenon of compounding-meaning it assumes that the rewards or interest generated by the capital are extracted immediately rather than being reinvested back into the underlying pool.
If a decentralized protocol offers an APR of 36.5% on a stablecoin deposit, a simple linear projection divides this rate by the days of the year, yielding roughly 0.1% in daily rewards. If you deposit capital and never manually or automatically reinvest those daily payouts, your total return at the end of 365 days will align precisely with the stated baseline percentage.
Annual Percentage Yield (APY) Explained
Annual Percentage Yield, on the other hand, represents the real annual rate of return, taking into account the effects of compounding interest. Compounding occurs when your generated earnings are actively added back to your principal balance, allowing subsequent interest calculations to be performed on a larger capital base. Essentially, you begin earning interest on your interest.
Because APY factors in this exponential scaling, the stated APY of a protocol will consistently appear higher than its corresponding APR, provided the compounding frequency is greater than zero. To accurately calculate DeFi yields, you must know how frequently that compounding occurs-whether it happens daily, hourly, or per block execution. If you want to answer what is APY vs APR in crypto at an operational level, compounding is the exact mechanism you are looking for.
Real Examples of APY vs APR in Crypto
To see how these concepts function dynamically in actual market conditions, let us examine two standard scenarios frequently encountered when navigating decentralized exchanges and yield protocols.
Scenario A: Staking with an APR Architecture
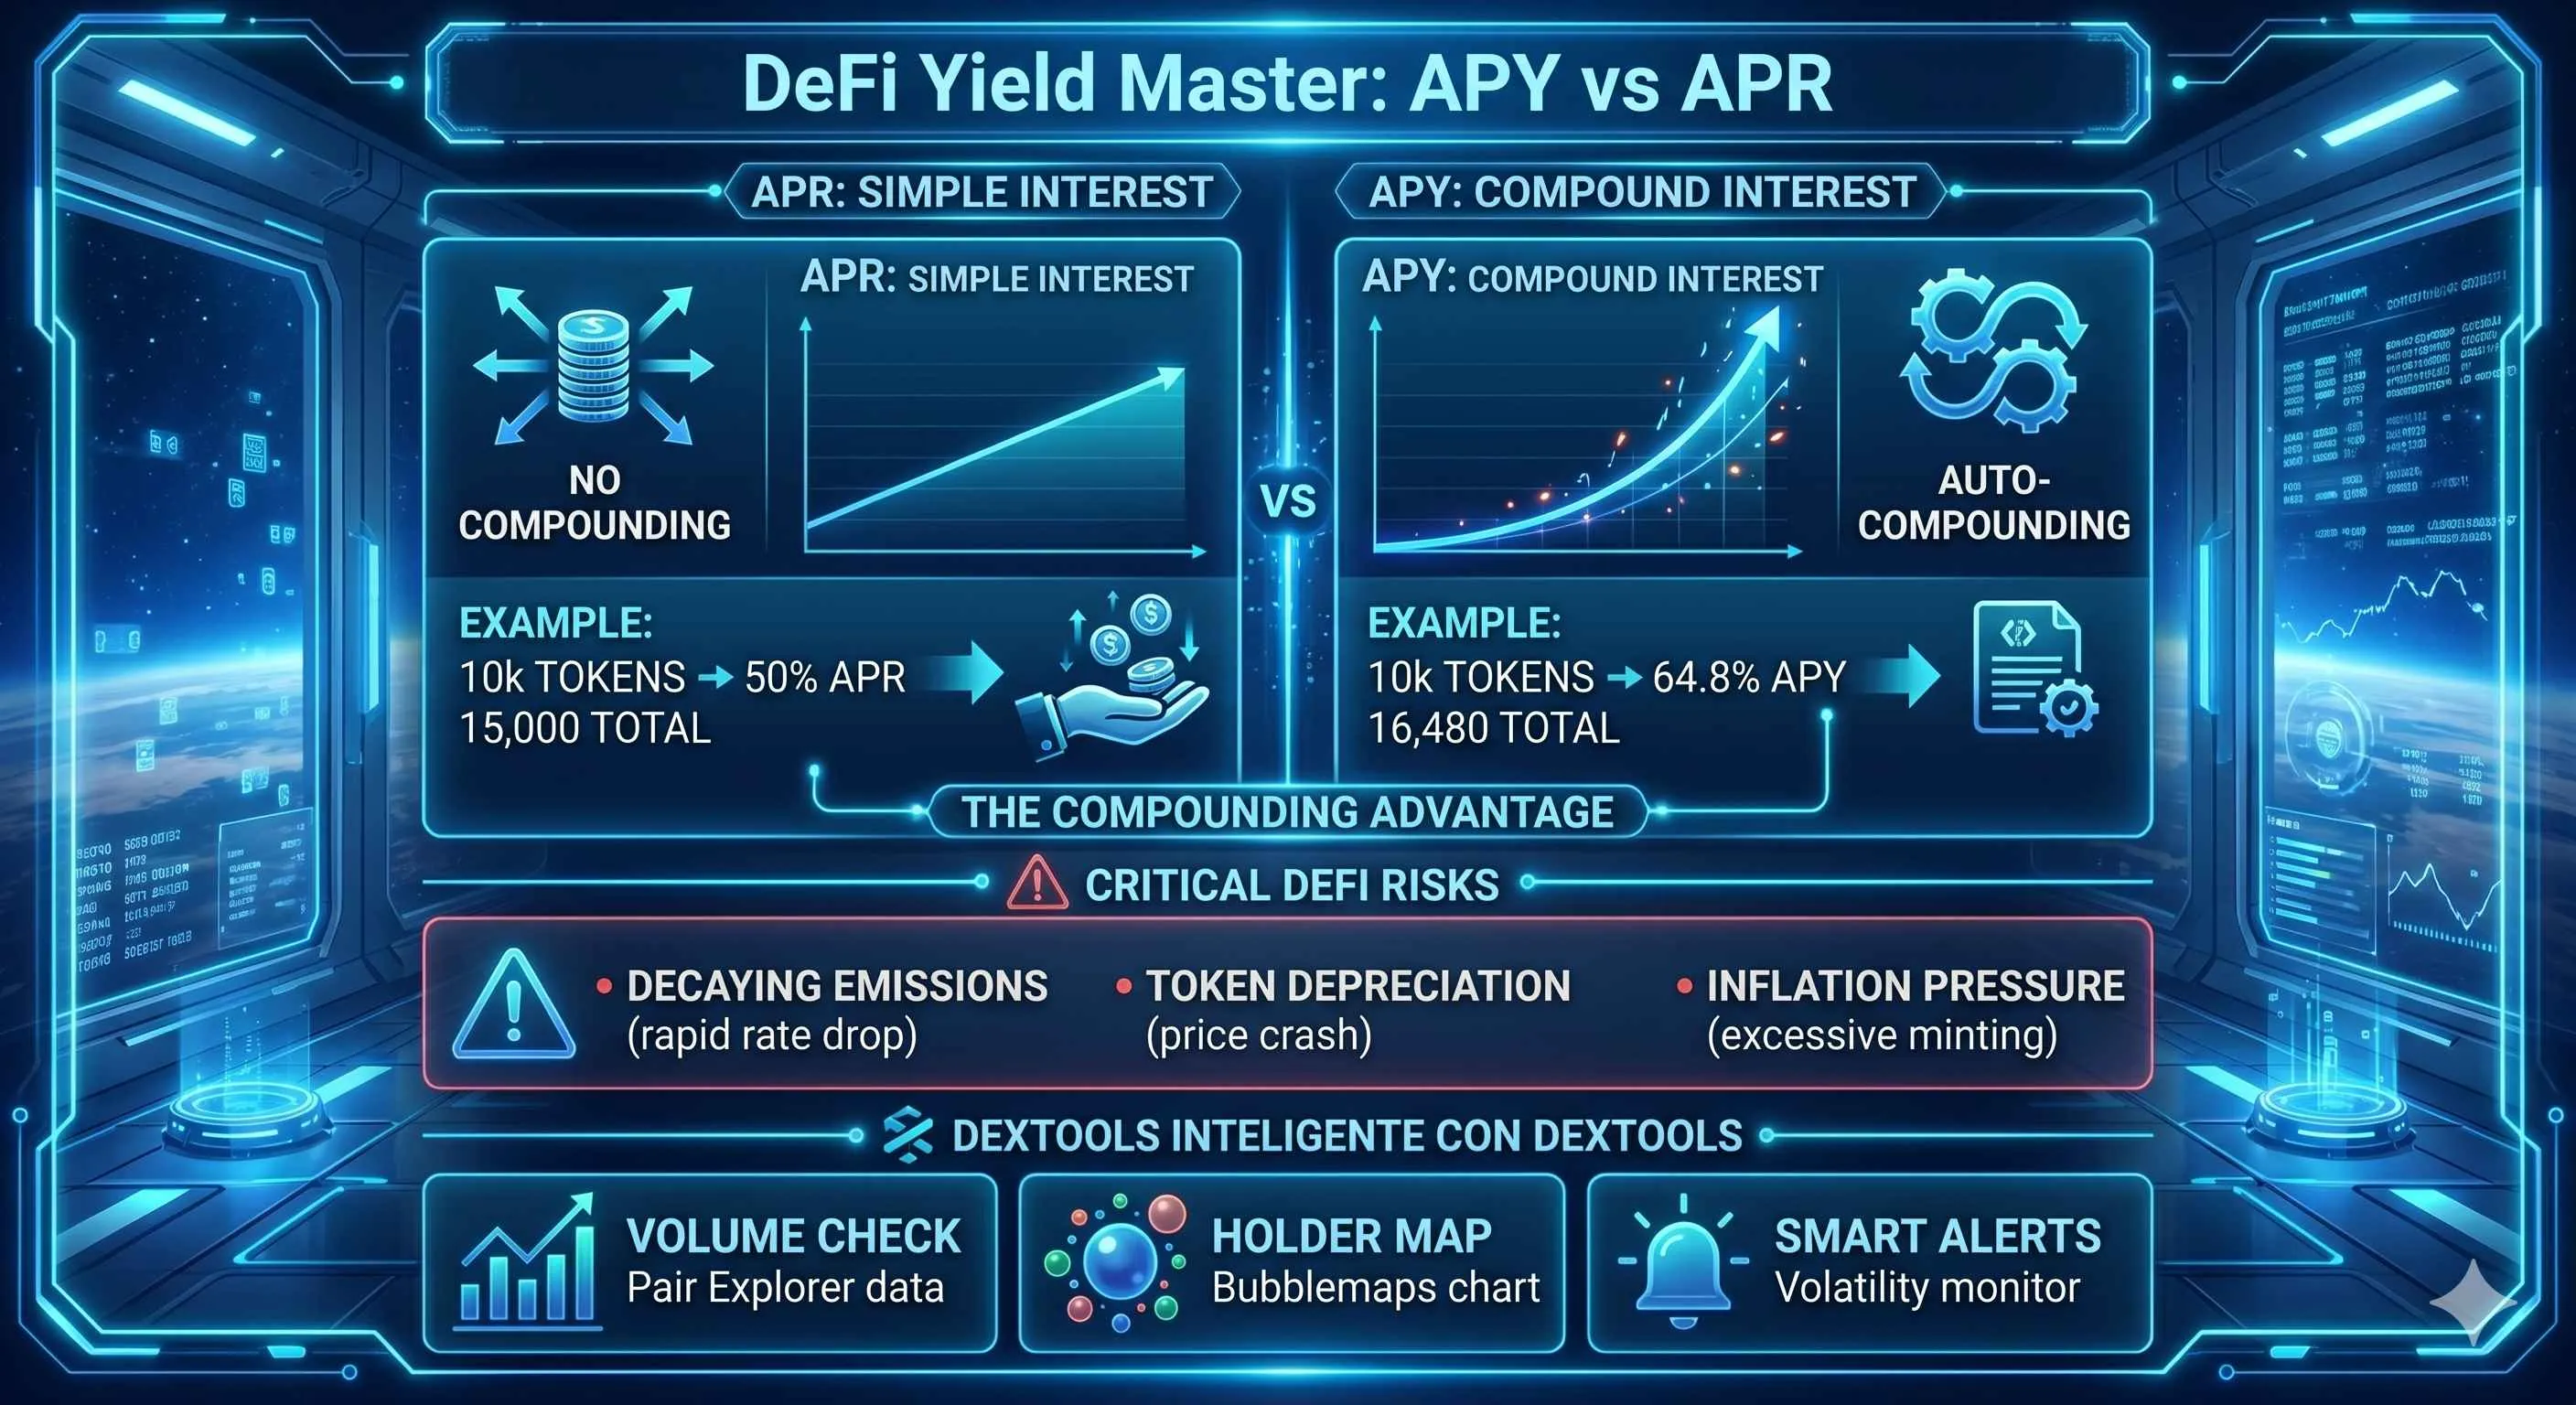
Imagine you identify a newly launched utility token on a decentralized exchange. The project offers a staking pool with a fixed 50% APR to incentivize long-term token retention. You decide to commit 10,000 tokens to this smart contract.
Because this specific interface operates strictly on a simple interest framework, your rewards accumulate linearly in a separate claim balance. Every day, you earn a fixed quantity of tokens based on your initial 10,000 token principal. At the end of one full year, you will have accumulated exactly 5,000 promotional tokens as a reward. Your final balance is 15,000 tokens. If you want to compound this position, you would have to manually execute a transaction to claim the rewards, pay the network gas fee, and deposit those rewards back into the primary staking contract.
Scenario B: Yield Aggregators utilizing an APY Architecture
Now, let us look at a yield aggregator protocol that automates this exact process. The aggregator takes your tokens and utilizes a smart contract loop to harvest rewards every single day, automatically swapping and re-depositing them back into the main staking pool on your behalf.
If the underlying pool has a base interest rate equivalent to a 50% APR, but the aggregator compounds those rewards on a daily frequency, the metric displayed on the dashboard will not say 50%. Instead, it will show an APY of roughly 64.8%.
Though the starting asset pool and the baseline performance are identical to Scenario A, the automated daily compounding configuration dramatically shifts the year-end outcome. At the end of 365 days, your 10,000 token deposit grows to approximately 16,480 tokens due to the exponential compounding curve. This crypto example highlights why understanding the mechanics of automated compounding is vital when comparing manual staking against automated vault products, directly answering what is APY vs APR in crypto in terms of final profitability.
The Hidden Variables: Why High Percentages Can Deceive
When browsing yield opportunities, it is common to encounter triple-digit or even quadruple-digit APY figures. While mathematically accurate based on instantaneous block conditions, these astronomical numbers rarely reflect the actual returns a trader will realize over a 12-month horizon. Truly understanding how these interest variations function in crypto requires identifying the structural variables that degrade these yields over time.
The Impermanence of High Emission Rates
Staking and yield-farming metrics are highly dynamic. High yields are typically sustained by aggressive token emissions-minting new native tokens to reward liquidity providers. As more market participants notice the high yield and deposit capital into the pool, the individual share of emissions decreases for every participant, causing the APR or APY to compress rapidly. A pool showing a 500% APY on Monday may drop to a 40% APY by Friday as capital floods the smart contract. Anyone searching for what is APY vs APR in crypto must realize that these rates represent a snapshot of the current block, not a permanent guarantee.
Price Depreciation and Token Inflation
A common pitfall for retail traders is chasing an elevated yield without analyzing the underlying asset's structural tokenomics. If a pool pays a 100% APY in a highly inflationary token, but the market price of that token drops by 80% over the year due to constant sell pressure from yield farmers, the dollar-denominated return will be deeply negative despite the accumulation of more tokens. Real wealth generation on-chain requires evaluating if the token's market demand can sustain the weight of its emission schedule.
Combining Yield Metrics with DEXTools Analysis
To navigate these environments without falling victim to predatory token mechanics, sophisticated traders use macro yield data in tandem with micro on-chain data provided by DEXTools.
Assessing Liquidity Pool Health via Pair Explorer
Before depositing tokens into a yield aggregator or an AMM liquidity pool to capture a high APR, you should vet the token pair on the DEXTools Pair Explorer. Look closely at the relationship between the pool's total volume and its actual depth.
If a pool claims an incredibly attractive yield but features minimal daily trading volume, the rewards generated from trading fees will be virtually nonexistent, meaning the yield is likely heavily reliant on artificial token inflation. Utilizing DEXTools pair explorer liquidity metrics lets you see if the pool has genuine transactional velocity supporting its existence, confirming what is APY vs APR in crypto pools backed by actual organic trading.
Analyzing Holder Concentration and Distribution
High-yielding protocols can be highly centralized, leaving participants vulnerable to sudden liquidity exits. By examining the Holder Analysis tab and integrating the Bubblemaps feature on DEXTools, you can evaluate the architecture of the token distribution.
If the wallets receiving the highest percentage of emissions are tightly clustered or controlled by a single entity, those entities possess the power to dump farmed rewards en masse, completely invalidating the projected APY. A healthy pool displays a broad, decentralized distribution of holders, indicating that token liquidation risk is naturally diversified.
Volatility Management with Price Alerts
Because compounding strategies take time to mature, price volatility is your primary risk factor. If you are locked into a staking protocol and the asset breaks down past a major structural support level, your accumulated yield can be erased in a matter of minutes.
Setting custom Price Alerts within DEXTools allows you to monitor critical technical levels in real time. If the price action threatens your capital baseline, you can make an informed decision to unstake or rebalance your position, rather than passively watching a declining asset erode your portfolio value.
Conclusion: Making Informed Allocation Decisions
Answering what makes a yield protocol truly sustainable requires looking past a single percentage and analyzing how rewards are processed over time. APR offers a transparent view of linear returns without assuming reinvestment, making it an excellent metric for calculating borrowing costs and basic liquidity provisioning. APY highlights the raw power of compounding interest but requires constant monitoring to ensure that token inflation or declining emission rates do not render the initial projections meaningless. Knowing what is APY vs APR in crypto structures is ultimately your first line of defense against capital decay.
Never judge a DeFi opportunity solely by the size of the percentage displayed on a web dashboard. Pair these yield metrics with the deep, real-time diagnostic tools found on DEXTools-such as holder analysis, volume validation, and precise liquidity monitoring. By blending mathematical clarity with rigorous on-chain investigation, you can bypass speculative traps and maximize your long-term capital efficiency.
- APY vs APR in Crypto: The Real Yield Difference
- What Is Real Yield in DeFi? Sustainable vs Emissions-Based Yield
- What is TVL? Total Value Locked Explained
- Liquidity Incentive Traps: When Rewards Attract Farmers, Not Real Buyers
Disclaimer: This article is for informational purposes only and does not constitute investment advice, financial advice, trading advice, or any other kind of advice. DEXTools does not recommend buying, selling, or holding any cryptocurrency or token. Users should conduct their own research and consult with a qualified financial advisor before making any investment decisions. Cryptocurrency investments are volatile and high-risk. DEXTools is not responsible for any losses incurred.