FDV vs Market Cap in Crypto Explained (2026)
— By Tony Rabbit in Tutorials
Learn how to compare FDV vs market cap in crypto, spot low-float launch risk, read unlock schedules, and tell when a cheap-looking token is not cheap.
Intent check: This page is the practical screening angle, focused on FDV vs market cap and unlock risk. If you want the base definition of fully diluted valuation first, read What Is FDV in Crypto?.
If you have ever looked at a token with a tiny market cap and a billion-dollar valuation tag right next to it, you have already met FDV. Fully Diluted Valuation, usually shortened to FDV, is the most misunderstood number on every crypto price tracker, and in the 2024-to-2026 cycle it became the most important screening metric in the industry.
This guide answers what is FDV in crypto in plain language, then goes deeper than the typical Coinbase Learn or Binance Academy entry. You will see the formula, the comparison with market cap, the "low float, high FDV" 2024 controversy that turned Wormhole, Starknet, Eigenlayer and ZetaChain into cautionary tales, the unlock dashboards professional researchers actually use, and the red flags that should make you walk away from a token before you even look at the chart.
FDV is not a price prediction. It is a pressure gauge. By the end you will know how to read it and when to trust it.
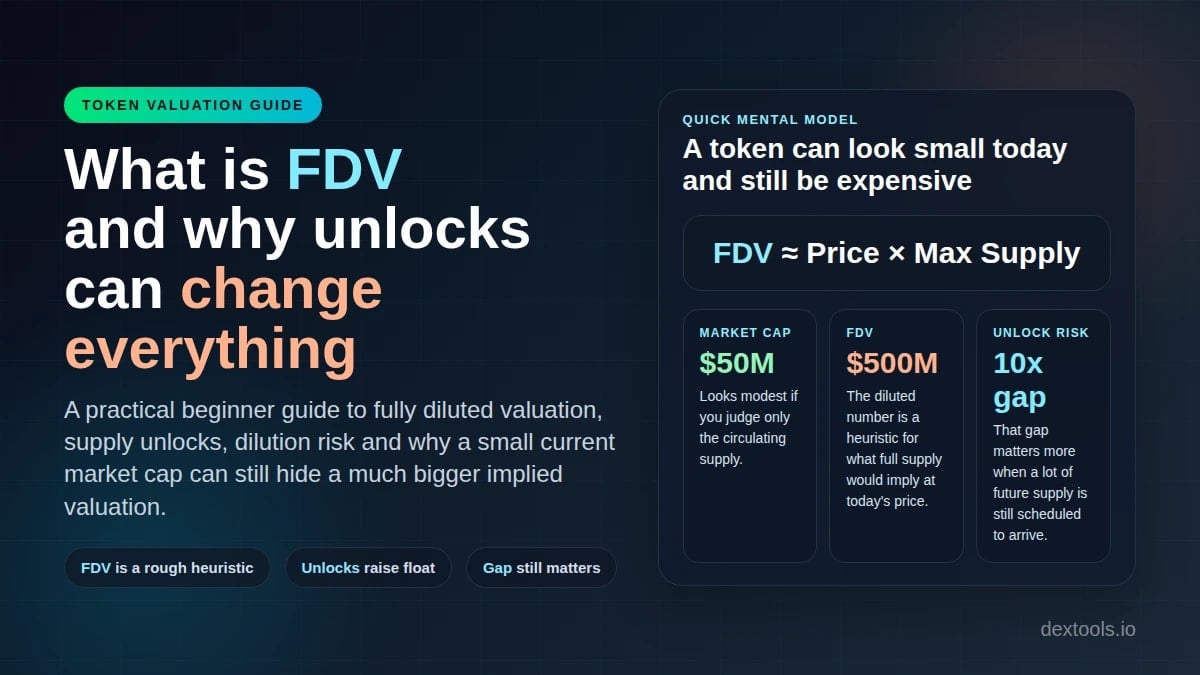
FDV (Fully Diluted Valuation) equals the current token price multiplied by the maximum supply. It represents the project's theoretical market value if every token that will ever exist were already in circulation today. FDV is used to compare future supply pressure against current market cap, and a large gap between the two signals that significant token unlocks are still ahead.
What Is FDV in Crypto? Definition and Formula
FDV stands for Fully Diluted Valuation. It is a forward-looking market cap calculation that uses the maximum or fully diluted supply of a token instead of the circulating supply. In traditional finance the closest cousin is the fully diluted share count used for stock options and convertible debt, but in crypto the dilution is usually scheduled, public, and far more aggressive than anything you would see on a Nasdaq listing.
The formula is simple on its surface and dangerous underneath. The dangerous part is the word "maximum". Some tokens have a hard cap, some have inflationary issuance with no cap at all, and some have burn mechanics that quietly shrink supply over time. Three projects can quote the same FDV and mean three completely different things.
Example: a token at $2.00 with a max supply of 1,000,000,000 has an FDV of $2 billion.
Same token at $2.00 with only 100,000,000 tokens in circulation has a market cap of $200 million.
In our example that ratio is 0.10, meaning only 10% of the eventual supply is live. The other 90% is still locked.
These numbers are not academic. They are the typical shape of a post-2024 token launch, where teams learned that a low circulating float produces a high quoted price and flattering headlines. FDV is what tells you that flattering price is built on a small slice of the full pie.
If you are still building the foundation, our companion piece on market cap formula and meaning walks through circulating supply, and the broader DeFi guide sets the context for unlock schedules.
The History of FDV: From Footnote to Front Page
FDV was almost invisible to retail traders for most of crypto history. Through the 2017 ICO era, market cap rankings on CoinMarketCap dominated the conversation. Bitcoin had a hard cap of 21 million, Ethereum had no cap, and the difference rarely mattered to anyone outside whitepaper authors.
The shift began in 2020 and 2021. As DeFi summer pushed dozens of new tokens into circulation with cliff schedules, four-year vesting, and aggressive team allocations, traders noticed that "circulating supply" was a moving target. CoinMarketCap and CoinGecko added FDV columns to their default views, and Messari pushed the metric into institutional research.
The real inflection point arrived in early 2024. Major launches like Wormhole, Starknet, Eigenlayer and ZetaChain came to market with circulating floats of under 15% and FDVs of 5 to 20 billion dollars. The phrase "low float, high FDV" became shorthand for an entire category of bad trade. By 2026 FDV sits next to price and 24-hour volume as one of the three numbers every serious researcher checks first.
How FDV Is Actually Calculated: Three Common Cases
Most articles stop at "price times max supply" and call it done. Real tokens are messier. Here are the three calculation patterns you will encounter, ranked from clean to nearly impossible to interpret.
Bitcoin caps at 21 million. Each new token approaches that ceiling and stops. FDV is unambiguous. Once max supply is reached the gap between market cap and FDV vanishes forever. This is the rare case where FDV gives you a single trustworthy number.
Most layer 1 chains and many DeFi tokens use schedules where issuance falls over years. Aggregators pick a snapshot date (often 10 years out) for the "max supply" figure. The number is defensible but it is a model output, not a constant.
Ethereum, MakerDAO, Curve and many other tokens have no fixed ceiling at all. Aggregators often substitute total supply for max supply, but the FDV figure is essentially a polite fiction. For these tokens you should weight market cap heavily and treat FDV as a directional hint at best.
Burn mechanics complicate the picture further. Ethereum's EIP-1559 destroys ETH on every transaction. BNB runs quarterly burns. Some meme tokens implement burn-on-transfer code that quietly drains supply with every swap. In all of these cases, the "max supply" used in the FDV calculation is actually a moving target moving downward, which makes the headline number conservative rather than aggressive.
The practical takeaway: before you trust any FDV figure, click through to the token's tokenomics page and ask one question. Is the supply number a fixed ceiling, a 10-year model output, or a placeholder for an uncapped asset? The answer changes how much weight FDV should carry in your decision.
FDV vs Market Cap: The Ratio Every Trader Should Memorize
The most useful single number derived from FDV is the MC/FDV ratio, sometimes called the float ratio or circulating ratio. You get it by dividing the current market cap by the FDV. The result tells you what percentage of the eventual supply is already in the market.
A ratio below 0.20 does not mean the token will collapse. It means you are buying into a structure where the next few years of price action will be dominated by supply arrivals rather than demand fundamentals. You can absolutely make money in that environment, but only if you understand exactly when the cliffs end and the linear releases slow down.
A ratio above 0.80 does not mean the token is automatically a great investment either. It means the supply story is done. Whatever happens to price from here is about demand, narrative, and fundamentals, not dilution. That is a different game with different risks.
If you are layering this metric on top of other analysis, pair it with our walkthroughs on how to detect fake volume on crypto charts and backtesting, because thin organic volume and a low MC/FDV ratio together is the worst combination on the board.
The 2024 Low Float High FDV Controversy: Case Studies
Nothing made FDV famous faster than the 2024 listings cycle. A wave of high-profile launches arrived with VCs deeply in profit on paper, retail buying at the top of the price discovery range, and unlock schedules that promised years of incoming supply. Below are the four cases that defined the debate.
Wormhole (W)
Wormhole launched its airdrop in April 2024 with a circulating supply of approximately 1.8 billion tokens out of a 10 billion max supply. The token opened around $1.66, which produced a market cap near $3 billion and an FDV close to $17 billion. The MC/FDV ratio at launch was roughly 0.18, deep in the danger zone. By mid-2025 the price had drifted down significantly as scheduled unlocks added tokens to a market that was no longer in airdrop frenzy mode.
Starknet (STRK)
Starknet's February 2024 launch is the textbook example of how FDV shapes a narrative. Around 700 million tokens were circulating at launch out of 10 billion total. With an opening price near $2, the token printed an FDV close to $20 billion against a market cap of about $1.4 billion. The community pointed out that this implied a fully diluted valuation roughly equal to Polygon's at the time, despite Starknet having a fraction of the on-chain activity. The unlocks that followed put steady pressure on price throughout 2024 and 2025.
Eigenlayer (EIGEN)
Eigenlayer's EIGEN token went live in October 2024 with one of the smallest initial floats of any major launch. Of the 1.67 billion token supply, less than 200 million were circulating at the start. The launch was further complicated by transfer restrictions that delayed when claimers could sell, creating a coiled spring of supply that arrived as soon as the lock lifted. The FDV-to-circulating-cap ratio at launch was above 10x, and price action through 2025 reflected the steady incoming float.
ZetaChain (ZETA)
ZetaChain rounded out the cycle with a January 2024 launch that quoted an FDV of roughly $1.7 billion on a circulating cap closer to $300 million. Like the other three cases, the structural issue was not the technology, it was the asymmetry between insider entry prices and retail entry prices, amplified by an aggressive linear release schedule that stretched into 2027 and beyond.
What every one of these examples shared was a clean MC/FDV ratio of under 0.20 at launch and a multi-year vesting schedule that nobody could absorb without proportional demand growth. None of these projects are necessarily bad. The point is that the entry valuation, not the project quality, was the variable retail buyers were systematically underestimating.
The 2024 cycle showed that when a token launches with under 20% circulating float and an FDV measured in billions, the buyer at the top of the launch range is often providing exit liquidity to investors who entered at a small fraction of that price years earlier. The mechanics of supply matter more than the narrative around the project.
Token Unlock Schedules: Cliffs, Vesting and Linear Release
To use FDV correctly you have to understand the structure that turns max supply into circulating supply over time. Three terms do most of the work: cliff, vesting, and linear release.
A cliff is a period after token generation during which an allocation is fully locked. Twelve-month cliffs are common for team allocations. During the cliff, none of those tokens can move. The moment the cliff ends, a large initial chunk usually unlocks at once, which is why traders watch cliff expiration dates so closely. A cliff ending in a thin liquidity environment can produce dramatic single-day supply increases.
Vesting is the broader schedule under which locked tokens are released over time. Vesting can be linear, stepwise, or milestone-based. Linear vesting is the most common in 2026: after the cliff, an equal portion of the allocation unlocks every block, day or month for a fixed duration. Four-year linear vesting after a one-year cliff is the de facto industry default for VC and team allocations.
Linear release is the post-cliff phase itself. It is the slow, predictable, daily drip of tokens onto the market that defines the long term price floor of a young project. If the daily release amount is large relative to daily organic buying, price has to absorb constant pressure. If demand is strong, that pressure is invisible. If demand falters, the chart bleeds.
Usually 12-month cliff, then 36 to 48 months linear. Sets the long term overhang of insider sales.
Cliff lengths vary by round (seed often 12 to 18 months, Series A 6 to 12). Entry prices can be a tiny fraction of launch.
Often unlocked at TGE but spent slowly through grants. Less prone to dump, but still adds to potential float.
Frequently unlocked at TGE. Can produce immediate, concentrated selling from claimers who treat it as found money.
When you read a tokenomics page, do not skip past the allocation pie chart. Map each slice to its cliff and vesting schedule, then build a mental picture of how much new supply enters the market each month for the next four years. That picture is the real story behind the FDV number.
How to Track Unlocks: The Three Dashboards That Matter
You no longer need PDFs to read a vesting schedule. Three free tools do the lifting in 2026.
The most visited dashboard for upcoming unlock events. Shows next 7-day, 30-day and 90-day cliff and linear releases sorted by dollar value. Lets you filter by allocation type so you can separate insider unlocks from ecosystem releases.
Deeper historical view with charts that overlay unlock events on price. Useful for studying how individual tokens have reacted to past cliffs, which is the best evidence you have for how they will react to future ones.
Integrated with DefiLlama's broader token data. Strong for comparing unlock pressure across a sector (for example all DeFi tokens with unlocks in the next 30 days). Best free tool for sector-level views.
The workflow is simple. Before you buy any post-2023 token, open one of these dashboards and look at the next 90 days of unlocks for that asset. If a single event is larger than 5% of current circulating supply, you have identified a near-term pressure point that price is likely to respect.
This methodology pairs well with on-chain checks like Bubblemaps wallet clustering and broader research routines such as our guide to how cryptocurrencies work. The combination of supply analysis and wallet analysis is what separates research from gambling.
FDV Manipulation Tactics: How Projects Game the Number
FDV is a number, and numbers can be engineered. Teams know retail tools display certain figures by default, and design tokenomics to make those figures look flattering. Four manipulation tactics are worth knowing.
The first is the low float launch. By launching with under 10% of supply circulating, a project can quote a high token price and a low market cap simultaneously, creating the illusion of an "early" opportunity while carrying an aggressive diluted valuation. This is the 2024 playbook described above.
The second is headline max supply manipulation. Some projects technically cap supply at a round number but include a governance mechanism that can later mint additional tokens. The FDV displayed on aggregators uses the headline cap, but the real ceiling is decided by future votes.
The third is rebasing tokens that change supply algorithmically. The FDV figure becomes essentially meaningless because the denominator moves with every rebase event. The fourth is concentrated TGE airdrops. When 5 or 10% of supply hits the market on day one via airdrop to thousands of wallets, the immediate selling pressure is enormous, but the headline circulating supply makes the token look healthier than it is.
Before trusting any FDV figure, verify these four things on the project's tokenomics page or contract:
- Is the max supply hard-coded in the contract or governed by future votes?
- Are there mint functions accessible to admin or multisig?
- Does the token have rebase or elastic supply mechanics?
- What percentage of supply hits the market within the first 30 days of TGE?
FDV-to-Revenue Ratio: The Crypto Version of P/S
If FDV is the crypto answer to a fully diluted market cap, then FDV-to-revenue is the crypto answer to the price-to-sales ratio. It tells you what valuation the market is assigning to each dollar of fees a protocol generates today. For income-producing tokens (DEXes, lending protocols, perpetuals exchanges, oracle networks) it is one of the few comparable valuation metrics that actually carries weight.
The formula is straightforward. Take FDV, divide by annualized protocol revenue (not total trading volume), and you get a multiple. A multiple of 10 means the market is paying $10 of diluted valuation for every $1 of yearly revenue. A multiple of 200 means the market is pricing in extreme growth or has wandered into pure narrative pricing.
TokenTerminal is the dominant data source for this metric in 2026. It standardizes revenue definitions (fees that flow to the protocol or token holders, not LPs) and computes FDV-to-revenue multiples you can sort and filter. Looking at the same sector through this lens is the closest thing crypto has to a P/S screening tool.
Top 10 Crypto by FDV (2026 Snapshot)
FDV rankings shift more than market cap rankings because supply schedules and price both move. The list below is a representative 2026 snapshot of the largest crypto assets by fully diluted valuation, useful as context for what "big" actually means at the top of the market.
The pattern is instructive. The top of the market is dominated by tokens with mature MC/FDV ratios above 0.70. Most of the supply that will ever exist is already in the market, so price moves reflect demand changes rather than supply arrivals. The exceptions (XRP and TON) carry visible structural reasons for their lower ratios.
FDV vs Traditional Finance Valuation: Why P/E Doesn't Apply
Stock analysts grew up with price-to-earnings ratios. In equities, every share entitles you to a residual claim on company profits, and P/E is consistent because every share is functionally equivalent. Crypto is not like that. Tokens can be governance rights, gas tokens, fee claim tickets, or pure speculative units with no economic right at all. Earnings in the GAAP sense do not exist for most of them.
This is why FDV-to-revenue has replaced P/E as the dominant valuation multiple in crypto. It standardizes the numerator (fully diluted value) and uses the most comparable denominator available (protocol revenue). Comparing two DEXes or two perpetuals exchanges with each other is meaningful. Comparing a stablecoin issuer with an L1 chain is not.
The other key difference is scheduled dilution. A public company might dilute existing shareholders by 1 to 2% per year through stock options. A typical crypto token can dilute existing holders by 10 to 30% per year for the first three years post-launch. That makes FDV-aware analysis essential in a way it simply is not for stocks.
Case Studies: High FDV Failures and Low FDV Successes
Theory is easier with examples. Two short pairs illustrate how the same metric can play out very differently.
High FDV Failure: 2018 EOS
EOS launched in 2018 with one of the largest FDVs in crypto history, peaking near $18 billion. An enormous diluted valuation combined with a one-year ICO that sold tokens at progressively higher prices and a delivery roadmap that fell short produced years of price decline. Valuation set at launch can take years to deflate even when fundamentals catch up.
Low FDV Success: 2020 Ethereum
Pre-DeFi-summer Ethereum traded with a market cap and FDV that look quaint in retrospect. Buying ETH at $200 in early 2020 implied an FDV under $25 billion. The technology shipped, demand exploded, and the same asset carries a fully diluted valuation more than 20 times higher today. The pattern: identifiable demand catalyst, no overhanging unlock schedule, and a valuation that left room to grow.
Low FDV Success: Early DeFi Bluechips
Aave, Uniswap and MakerDAO all traded with low FDVs in early 2020. Their unlock schedules have largely completed, demand grew with the cycle, and each carried to multi-billion-dollar valuations during the 2021 peak. The conditions for success (real product, manageable supply, growing demand) were visible in advance.
FDV is best used as a screening tool. It tells you what valuation you are entering. Whether that valuation pays off depends on demand, execution, narrative, and time. For broader market context check our coverage on ETH market analysis and how to sell ETH effectively.
How to Value Pre-Launch Tokens Using FDV
Pre-launch is where FDV thinking earns its keep. Before a token has a market price, you can still calculate the implied valuation of every funding round if you know the round price and the total supply. This is the same arithmetic VCs use to size their positions, and it answers a question most retail investors never ask.
The question is: what FDV did the last private round price imply, and how does that compare to the FDV being quoted on the public listing? If a project raised at a $200 million implied FDV in its Series A and then launched at a $2 billion implied FDV, the public buyer is entering at 10 times the price the latest insiders paid. That gap is not automatically wrong (markets can revalue projects between rounds), but it should be a conscious decision rather than an accident.
The mechanics are simple. Take the round size, divide by the percentage of supply sold in that round, and you get the implied valuation of the whole pie. Most projects disclose round details in their tokenomics documentation, and aggregators like Messari and CryptoRank publish round-by-round breakdowns for the major launches.
If you are evaluating an airdrop opportunity, the same logic applies. The implied FDV at TGE is set by the team. A high implied FDV with an aggressive unlock schedule is a worse setup for airdrop hunters than a low implied FDV with most of the supply already in their hands. Our walkthrough on using burner wallets for airdrops covers the operational side, but the valuation side is where most of the long term outcome is determined.
FDV Trap Warning Signs: A Pre-Buy Checklist
By now the patterns should be clear. Here is the consolidated checklist most professional crypto researchers run through before opening a position in any token with a meaningful supply overhang.
- MC/FDV ratio under 0.20 confirms heavy dilution still to come.
- Cliff expiration within next 6 months can produce single-day supply increases above 5%.
- Daily linear release greater than 0.3% of float creates sustained downward pressure.
- VC entry prices below 10% of launch price point to a large structural seller pool.
- Airdrop concentration above 5% of supply at TGE means immediate sell pressure from claimers.
- Max supply governed by future votes means the quoted FDV may understate true ceiling.
- FDV-to-revenue above sector median shows the market is already pricing in growth.
- Thin DEX liquidity relative to FDV means small dumps move price disproportionately.
You do not need every box to be clean. You do need to know which boxes are checked before you decide your position size. A token with three of these red flags can still produce a great trade if the entry timing is right, but it is no longer a buy-and-hold candidate. It is a tactical position that has to be managed actively.
If you want to make these checks fast and repeatable, build a personal template that ties together our tutorials on tokenization, oracle pricing, and DEX aggregator routing. The combination of valuation, data quality, and execution venue is the full picture a serious researcher carries in their head before placing a trade.
FDV in DeFi vs Layer 1 vs Memecoins
FDV behaves differently across token categories. DeFi tokens usually have transparent revenue, making FDV-to-revenue the most useful metric. The number to compare across DeFi tokens is that multiple, not raw FDV.
Layer 1 and Layer 2 blockchains are valued more like sovereign economies. The right comparable is total value secured, settlement throughput, and validator economics. FDV here should be cross-checked against on-chain metrics like daily fees, active addresses, and TVL hosted. The NEAR Protocol guide and Sui Network guide walk through this for two specific examples.
Memecoins are the wild card. Most carry uncapped or fully circulating supplies, so FDV either equals market cap or is meaningless. The relevant metrics are top-10 wallet concentration, liquidity depth, and holder count. Stablecoins have FDV equal to market cap by construction, since each unit is issued against a deposit. Our Tether USDT guide covers the supply mechanics in detail.
Common Mistakes Traders Make With FDV
Even experienced traders fall into recurring traps when reasoning about FDV. Five are worth naming.
FDV at today's price is a snapshot, not a forecast. The actual price at full dilution can be anything from zero to many multiples of today.
A stablecoin issuer at $10B FDV and a memecoin at $10B FDV are not comparable. Compare within categories only.
A $500M FDV may be cheap in one sector and expensive in another. The right comparable is always sector median, not market median.
Tokens with active burns can shrink supply over time. The headline FDV may overstate the true future float for these assets.
The tokenomics page tells you what the FDV figure on an aggregator actually means. Skipping it is the single most expensive mistake retail investors make.
FDV and Risk Management: Position Sizing Implications
Most position sizing frameworks ignore supply structure and focus on volatility, drawdown, and correlation. FDV-aware sizing adds a fourth dimension: structural supply overhang. Scale position size inversely to expected float growth over your holding period. If you plan to hold 12 months and the token will double its circulating supply in that time, a position you would size at 5% of portfolio for a fully diluted asset should be sized smaller.
The goal is to make supply overhang an explicit input rather than a chart surprise. Combine this with our coverage on liquidation zones and long vs short positioning for a complete risk framework that respects supply, leverage and liquidity together.
Tools and Data Sources for FDV Research in 2026
The data ecosystem around FDV has matured. The tools below are the ones professional researchers actually open every day.
Baseline FDV, MC, ratio displayed on every asset page. Free, fast, comprehensive coverage of any tradable token.
Best-in-class unlock calendar. Filter by next 7, 30, 90 days. Allocation type breakdown for each event.
Round-by-round funding history, vesting schedules, ICO/IDO price comparisons. Strong for pre-launch valuation work.
FDV-to-revenue multiples standardized across protocols. The de facto P/S tool for crypto in 2026.
Institutional research reports with full tokenomics breakdowns. Free tier covers most major assets.
Sector-level unlock and revenue dashboards. Best for comparing across an entire vertical at once.
You do not need to use all of them. A practical workflow is: CoinGecko for baseline numbers, TokenUnlocks for upcoming events, and TokenTerminal for the revenue multiple. Three tabs, ten minutes, and you have a defensible picture of any token's valuation.
Frequently Asked Questions
Q Q Q What is FDV in crypto in simple terms?
FDV stands for Fully Diluted Valuation. It is the price of a token multiplied by the maximum possible supply. It represents the theoretical total value of the project if every token that will ever exist were already circulating at the current price. FDV is used to estimate the future supply pressure on a token.
Q Q Q How do you calculate FDV?
Multiply the current token price by the maximum supply. For example a token priced at $0.50 with a max supply of 2,000,000,000 tokens has an FDV of $1 billion. If max supply is not hard capped, aggregators usually use a 10-year projected supply as the denominator.
Q Q Q What is the difference between FDV and market cap?
Market cap uses circulating supply (tokens already in the market). FDV uses maximum supply (all tokens that will ever exist). Market cap shows current value, FDV shows future value if every locked token were released. The gap between them tells you how much dilution is still scheduled to happen.
Q Q Q What is a good MC to FDV ratio?
A ratio above 0.80 indicates a mature token with most supply circulating. A ratio between 0.40 and 0.80 is healthy. Below 0.20 is a warning sign of significant future dilution. Below 0.10 is the classic "low float, high FDV" setup that the 2024 cycle made famous as a red flag.
Q Q Q Is a high FDV always bad?
No. A high FDV is not automatically a red flag. Bitcoin and Ethereum carry very high FDVs because the market believes their long term demand justifies it. A high FDV becomes dangerous when paired with a low MC/FDV ratio (heavy upcoming dilution), thin liquidity, and weak product traction. Context is what makes the number meaningful.
Q Q Q What was the 2024 low float high FDV controversy?
In early 2024 a wave of major token launches (Wormhole, Starknet, Eigenlayer, ZetaChain among others) came to market with under 15% of supply circulating and FDVs in the billions. Critics including Cobie argued that retail buyers were providing exit liquidity to VCs who had entered at fractions of the launch price. The phrase "low float, high FDV" became shorthand for the structural problem.
Q Q Q How do I track token unlocks?
The three main free tools are TokenUnlocks (token.unlocks.app) for upcoming events, CryptoRank for historical vesting analysis, and DefiLlama for sector-level views. Before buying any post-2023 token, check the next 90 days of scheduled unlocks for that asset.
Q Q Q What is a token unlock cliff?
A cliff is a period after token generation during which an allocation is fully locked. Twelve-month cliffs are common for team and investor allocations. The day the cliff ends, a large initial chunk usually unlocks at once, which often produces visible supply pressure on the chart.
Q Q Q What is FDV to revenue ratio?
FDV to revenue is the crypto equivalent of the price-to-sales ratio in traditional finance. Divide FDV by annualized protocol revenue to get a multiple. Lower multiples (10 to 30) suggest cheaper relative valuation. Higher multiples (above 100) suggest the market is pricing in significant future growth.
Q Q Q Why doesn't P/E ratio work for crypto?
Most crypto tokens do not have GAAP earnings. Some accrue protocol revenue, some govern treasury distributions, some have no economic claim at all. FDV-to-revenue captures the most consistent signal across these different designs, which is why it has replaced P/E as the standard relative valuation multiple in crypto.
Q Q Q Can FDV be manipulated by projects?
Yes. Common tactics include launching with a low circulating float to inflate price, using governance-controlled max supply that can be raised by vote, employing rebase mechanics that distort the supply denominator, and concentrating airdrop distributions that exit immediately. Always check the tokenomics page and the contract itself before trusting a headline FDV.
Q Q Q Should I avoid all low MC to FDV tokens?
No. A low MC/FDV ratio is a structural warning, not an automatic disqualifier. Many successful projects launched with low ratios and grew into their valuations. The discipline is to be aware of the supply overhang, size positions accordingly, and pay attention to upcoming unlock events rather than ignoring them.
Conclusion: FDV as a Screening Filter, Not a Verdict
FDV started this decade as a footnote and finished it as a front-page metric. The 2024 cycle proved that structural supply matters more than narrative when entry valuations are high relative to current float. Traders who learned to read FDV alongside cliff schedules and revenue multiples spent 2024 and 2025 dodging the launches that disappointed.
The framework is straightforward. Calculate FDV as price times max supply. Compute the MC/FDV ratio. Check the next 90 days of unlocks on TokenUnlocks. Compare the FDV-to-revenue multiple against sector median on TokenTerminal. If three of four checks come back clean, the token deserves deeper research. If two or more come back red, walk away.
Pair the supply view with demand research using our guides on VWAP and volume analysis and wallet security best practices. Open DEXTools, pull up any token you are considering, and run the FDV check before you do anything else. Five minutes there can save months on the wrong side of an unlock schedule.
Related Guides
- Meme Coin Market Cap: How to Read Market Cap, FDV & Supply
- Market Cap vs FDV in Crypto: What the Gap Really Means (2026)
- How to Check Liquidity Lock Before Buying a Token: Unlock Risk and Locker Verification (2026)
- Meme Coin Position Size Calculator: Profit, Risk and Market Cap Scenarios (2026)
- How to Evaluate Tokenomics: Supply, Emissions and Unlock Risk Guide (2026)