What Is Williams %R in Crypto Trading? Indicator Guide (2026)
— By Tony Rabbit in Tutorials
Learn what Williams %R (Williams Percent Range) is in crypto trading, how it's calculated, and how to use this momentum oscillator on DEXTools.
What Is Williams %R?
Williams %R, also known as Williams Percent Range, is a momentum oscillator used in technical analysis. Created by Larry Williams, it helps traders identify overbought and oversold conditions in the market.
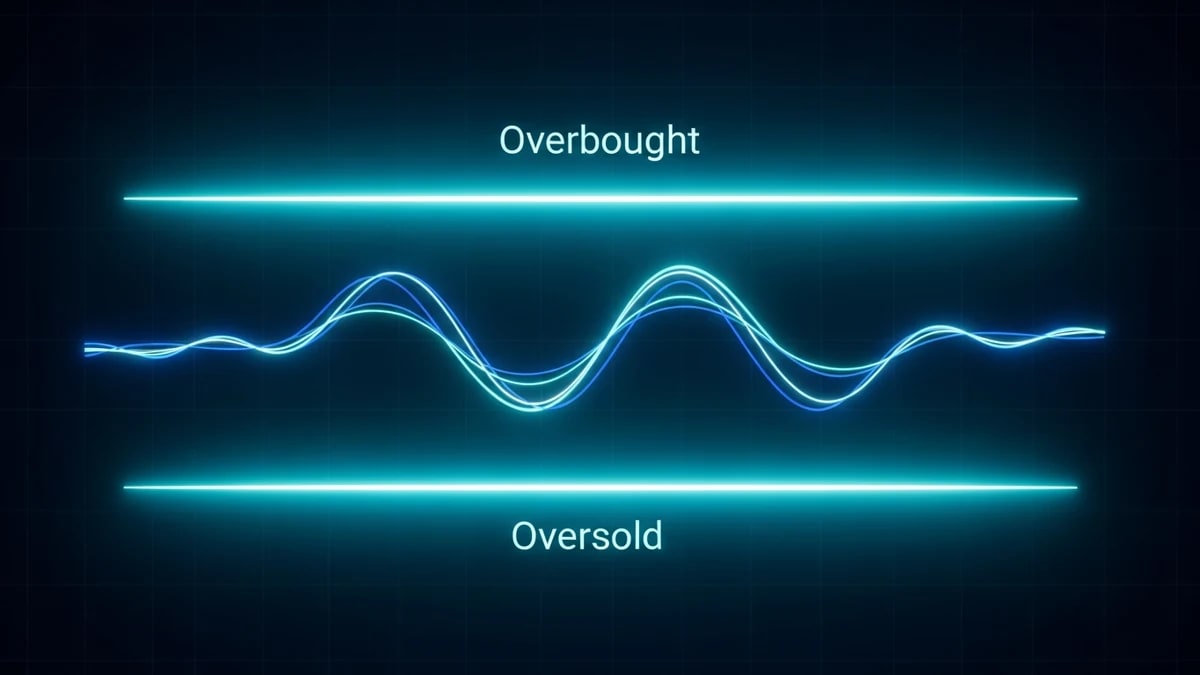
This indicator measures the current closing price relative to the highest and lowest prices over a specific lookback period. It typically appears as a single line on a chart, oscillating between 0 and -100.
How Is Williams %R Calculated?
The calculation for Williams %R compares the current closing price to the high-low range over a set number of periods. The most common lookback period is 14 periods, which could be 14 days, 14 hours, or 14 minutes, depending on the chart's timeframe.
The formula essentially shows where the current close is in relation to the highest high and lowest low of the chosen period. It's similar to the Stochastic Oscillator but inverted, meaning its values range from 0 to -100.
Understanding Overbought and Oversold Signals
Williams %R provides clear zones for potential overbought and oversold conditions. These signals can help traders anticipate possible price reversals.
Readings from 0 to -20 are generally considered overbought, suggesting that the price may be due for a pullback or reversal downwards. Conversely, readings from -80 to -100 indicate oversold conditions, potentially signaling an upcoming bounce or reversal upwards.

How to Trade with Williams %R
Traders often use Williams %R to spot potential entry and exit points. When the indicator moves into an extreme zone, it can suggest that momentum is stretched and a reversal might be near.
Here's a basic approach to using Williams %R in your crypto trading strategy:
- Identify Oversold. Look for Williams %R readings between -80 and -100, which suggests the asset might be oversold and due for an upward move.
- Confirm with Price Action. Before acting, look for bullish price action confirmation, such as a candlestick reversal pattern or a break above a short-term resistance level.
- Consider Entry. Once confirmed, you might consider a long position, anticipating a price increase.
- Identify Overbought. Conversely, look for readings between 0 and -20, indicating the asset might be overbought and due for a downward move.
- Confirm with Price Action. Seek bearish price action confirmation, like a bearish engulfing pattern or a break below a short-term support level.
- Consider Exit. With confirmation, you might consider closing a long position or opening a short position, anticipating a price decrease.
Williams %R vs. Stochastic Oscillator
While similar in function, Williams %R and the Stochastic Oscillator have key differences in their calculation and presentation. Both are momentum oscillators that identify overbought/oversold levels.
Limitations and Confirmation
While Williams %R is a valuable tool, it has limitations. In strong trending markets, the indicator can stay pinned at an extreme (either overbought or oversold) for extended periods.
This means that an overbought reading in a strong uptrend might not lead to a reversal, but rather a continuation of the trend. Therefore, it's crucial to confirm Williams %R signals with the overall market trend and other technical analysis tools.

Tips for Using Williams %R Effectively
- Trend Confirmation: Use Williams %R in conjunction with trend-following indicators like moving averages. Look for oversold signals in an uptrend and overbought signals in a downtrend.
- Divergence: Pay attention to divergence between the indicator and price. If the price makes a new high but Williams %R makes a lower high, it could signal a weakening trend.
- Multiple Timeframes: Check Williams %R on different timeframes. A signal on a shorter timeframe might be more reliable if confirmed by the longer timeframe trend.
Frequently Asked Questions
What is Williams %R?
Williams %R, or Williams Percent Range, is a momentum oscillator created by Larry Williams that measures overbought and oversold conditions in an asset.
How is Williams %R scaled?
It is scaled from 0 to -100, with readings from 0 to -20 indicating overbought conditions and -80 to -100 indicating oversold conditions.
What does Williams %R compare?
The indicator compares the current closing price to the high-low range over a specified lookback period, typically 14 periods.
How is Williams %R similar to the Stochastic Oscillator?
Williams %R is similar to the Stochastic Oscillator but is inverted, meaning its scale and interpretation of overbought/oversold levels are reversed.
How do traders use Williams %R?
Traders use Williams %R to identify potential price reversals and gauge market momentum, often confirming signals with the overall trend.