Why Is Bitcoin Down? BTC Slides Toward $74K as Yields, Oil and Liquidations Bite
— By Tony Rabbit in News
Bitcoin dropped toward $74K before rebounding. Here are the real drivers behind BTC weakness: long liquidations, rising yields, oil shock and macro de-risking.
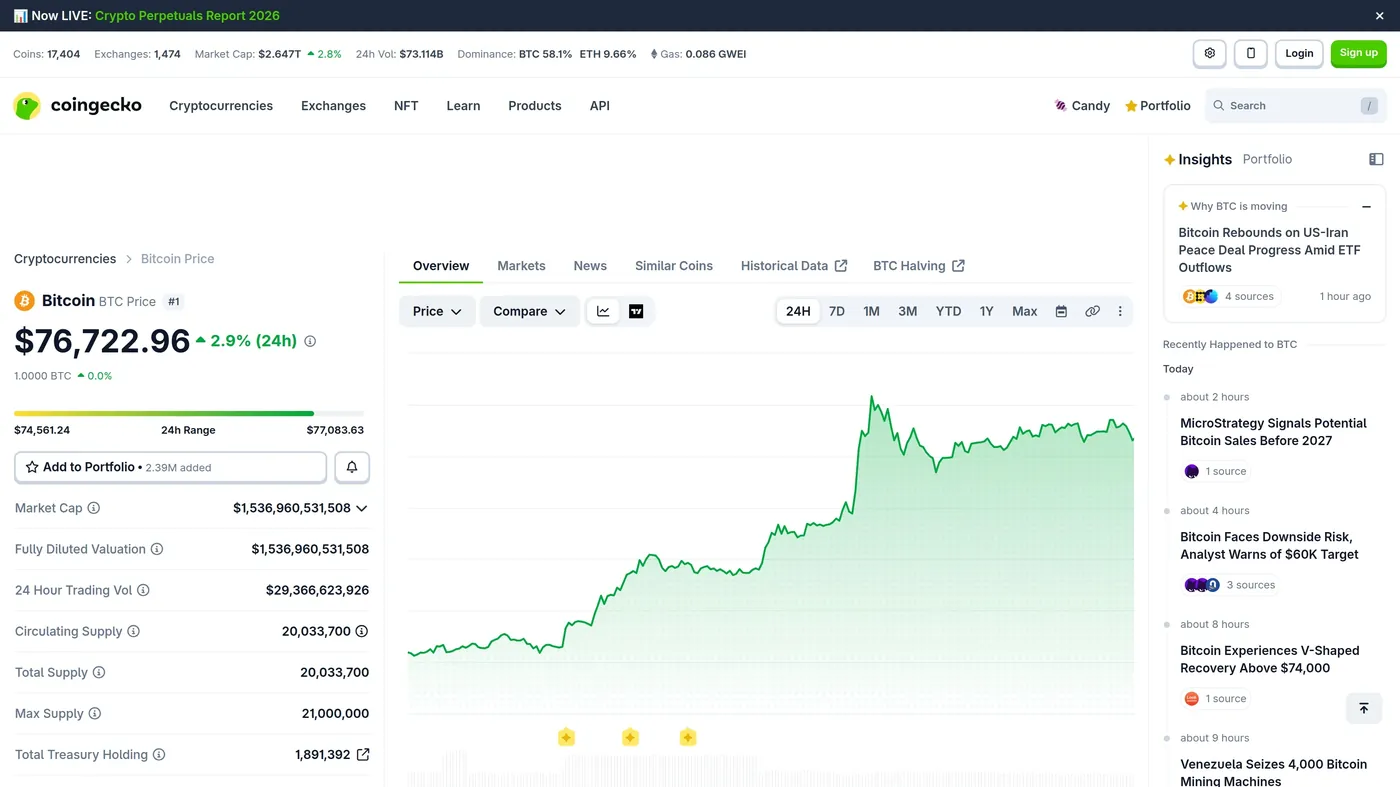
Bitcoin is trying to stabilise after a sharp May downdraft that briefly pushed the asset near $74,344 before a relief bounce carried it back toward $76,729. That rebound does not erase the damage. BTC remains roughly 39.1% below its October 2025 all-time high of $126,080, and the last few sessions have shown how quickly macro pressure can overwhelm crypto-specific optimism.
The simplest answer to the question "why is bitcoin down?" is that several headwinds hit at once. Leveraged longs were too crowded, Treasury yields kept rising, oil and Middle East risk revived inflation worries, and traders saw too little fresh capital willing to step in front of the move. In that environment, a slide that starts as a pullback can turn into a liquidation-driven flush very fast.
That matters because earlier this month BTC had already shown it could reclaim higher ground. DEXTools covered that strength in Bitcoin Surpasses $80K: Breakout or Ceiling?. The fact that price later slipped back under pressure tells you this was not a single-chart technical wobble. It was a macro-heavy unwind amplified by leverage.
The market backdrop is weaker than it looks at first glance
CoinGecko data at publication time showed bitcoin near $76,729 with a market cap of about $1536.94B, 24-hour volume near $29.12B, a 7-day change of -1.80% and a 30-day change of -1.40%. Those numbers do not describe a total collapse, but they do describe a market that has struggled to turn rebound attempts into a durable recovery.
The bigger point is positioning. A market can look calm on a one-day percentage basis while still carrying plenty of hidden fragility. That is exactly what recent crypto derivatives data suggested. Traders kept trying to buy the dip, but the structure of the rebound was not strong enough to hold when macro conditions turned against risk assets again.
Reason 1: leveraged longs were flushed out repeatedly
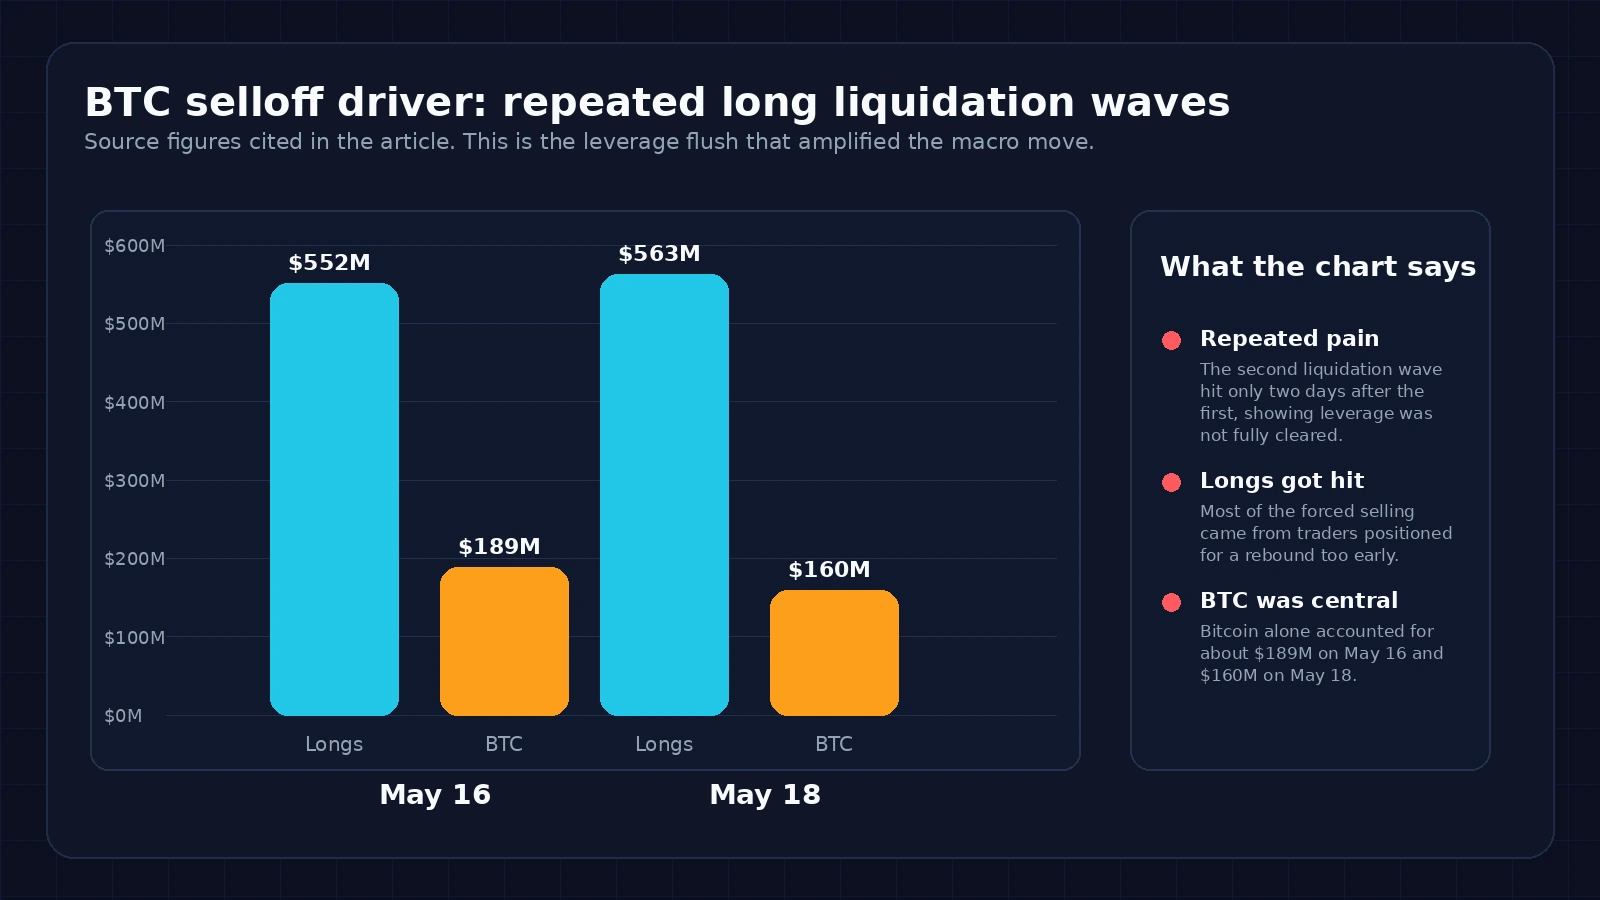
One of the clearest immediate causes of the drop was a liquidation cascade. CoinDesk reported on May 16 that more than $581 million in crypto positions were liquidated over 24 hours, with roughly $552 million of that coming from long positions. BTC alone accounted for about $189 million of the damage.
Two days later, CoinDesk reported another $563 million in long liquidations, with bitcoin contributing roughly $160 million. That is important because it shows the weakness was not one isolated purge. Traders kept leaning into upside recovery, and the market kept punishing that positioning.
Reason 2: yields and inflation fears made non-yielding assets less attractive
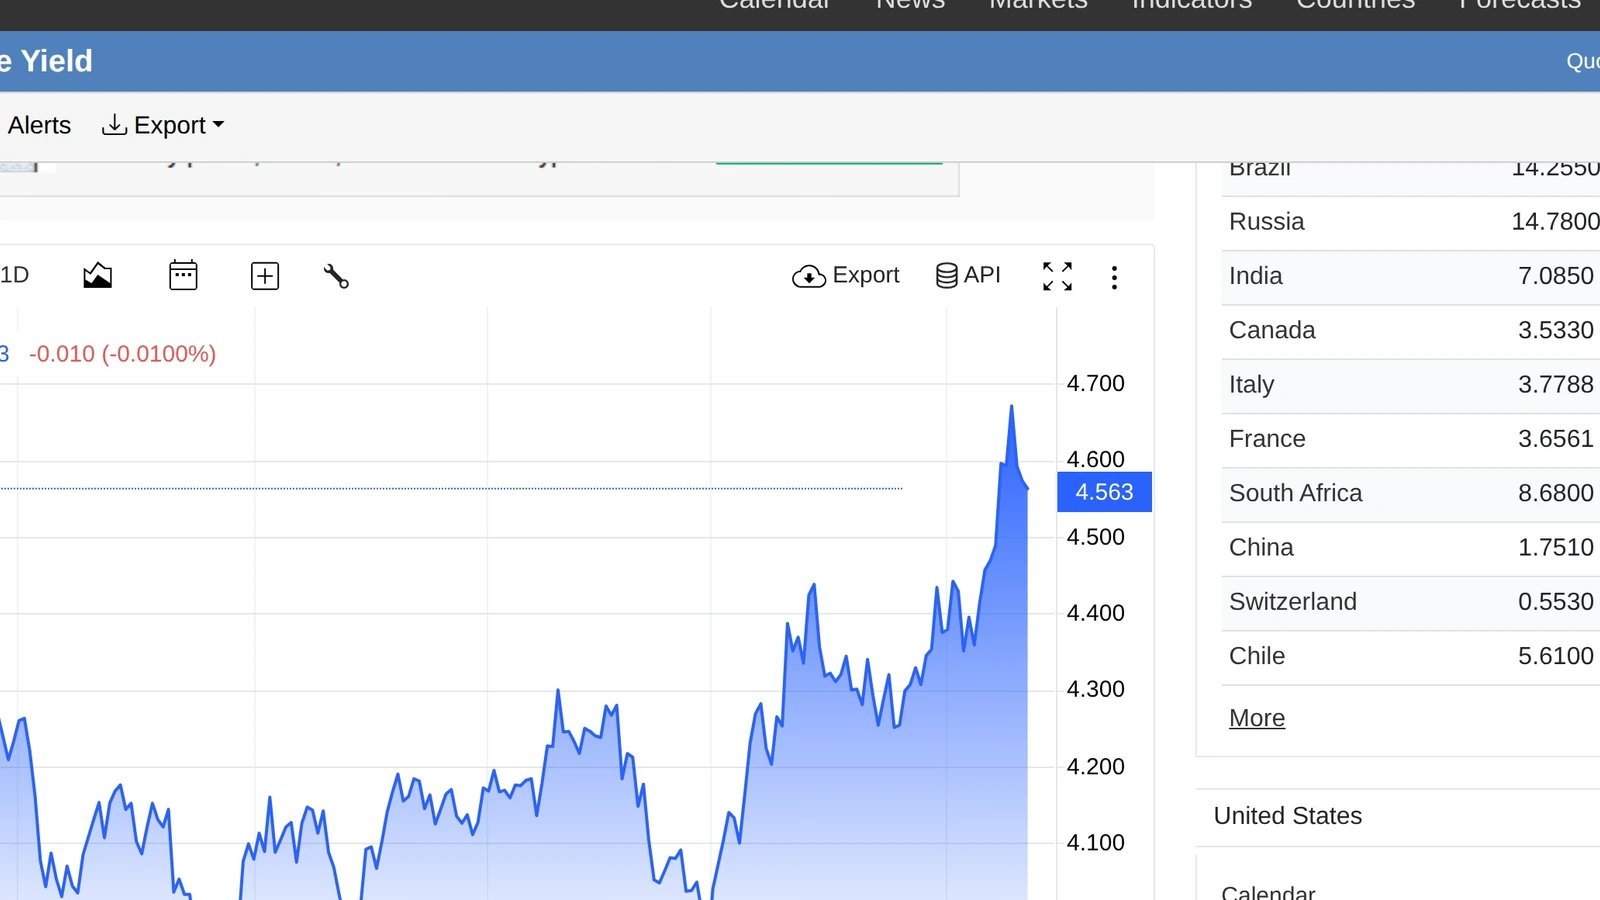
Macro pressure did a lot of the heavy lifting behind the BTC slide. CoinDesk said the May 16 selloff tracked a global bond selloff and the worst U.S. stock session since March. The report highlighted U.S. 10-year Treasury yields above 4.5%, Japan's 30-year debt at 4% and Brent crude above $105. The throughline, in its words, was inflation.
CoinDesk followed on May 22 with a more direct explanation. HashKey Research said the bigger problem was macro de-risking as long-term yields rose, oil and inflation risks stayed in focus and there was "currently no compelling reason for new capital to enter the market." For a non-yielding asset like bitcoin, that is a serious headwind.
Reason 3: oil and Middle East headlines kept moving the risk premium
Geopolitics was not just background noise in this move. Reuters wrote on May 5 that bitcoin's slump had been exacerbated by escalating Middle East tensions and broader risk aversion. That fits what traders saw later in May as oil stayed elevated and market focus returned to Iran and the Strait of Hormuz.
Then the reverse happened. CoinDesk reported on May 23 that bitcoin more than retraced an earlier drop after President Trump said an agreement with Iran and other countries had largely been negotiated, adding that the Strait of Hormuz would reopen. BTC jumped back toward $76,700 after falling near $74,000 earlier the same day.
That sequence is useful because it tells you the market has been trading bitcoin partly like a geopolitical risk barometer. When the probability of higher oil and wider conflict rises, BTC suffers. When the market sees a de-escalation path, BTC catches a relief bid.

Reason 4: the market lost momentum after the $80K recovery story faded
There is also a simpler structural reason for the decline. Once BTC failed to turn its move back above $80,000 into a convincing continuation, the market had to deal with disappointment. That matters because bullish narratives work best when price confirms them quickly. When price stalls, traders start taking profit and late longs become vulnerable.
That is why the current drop looks like more than a random red candle. It looks like a market that had started to price in easier conditions and cleaner upside, only to run into hotter macro data, rising yields and persistent conflict risk. The unwind then fed on itself through derivatives positioning.
What traders should watch next
The near-term map is not complicated. First, traders need to see whether the $75,000 to $77,000 area continues to behave like support, as CoinDesk's May 22 analysis suggested. Second, they need to watch long-term yields and oil more closely than usual, because those variables have been driving the risk mood behind this move. Third, they should track whether any rebound is coming from healthier spot demand or just another short-lived derivatives squeeze.
There is also a broader context check worth making. Earlier in May, DEXTools covered strong ETF momentum in Bitcoin ETF Weekly: Flows hit $60B as BTC Reclaims $80K. The recent slide suggests that even solid structural adoption stories can get overwhelmed temporarily when macro conditions, inflation fears and leverage all line up against the market.
Final take
Bitcoin is down because the market got hit by a stacked set of pressures, not one isolated bad headline. Leveraged longs were flushed repeatedly, bond yields climbed, oil and Iran-related risks pushed inflation concerns back to the center and traders did not see enough immediate reason to deploy fresh capital.
The result was a slide toward the mid-$74,000s before a geopolitical relief headline produced a rebound. That bounce matters, but it does not invalidate the reasons behind the weakness. For now, BTC still looks like a macro-sensitive asset trading inside a market that wants clearer signs of falling yields, calmer energy markets and stronger conviction from buyers.