ETF Flows: Deciphering the Institutional Pulse

Institutional fund tracking is the new North Star for market analysis. We deconstruct the data sources, reporting methodologies, and the significance of tracking net inflows and outflows.
ETF Flows
- In the modern digital asset ecosystem, institutional demand is the primary driver of macro-scale price discovery. While retail sentiment can be fickle and driven by viral social media trends, the movement of institutional capital is documented with cold, mathematical precision.
- ETF Flows serve as the definitive high-fidelity signal for this institutional activity. By understanding how to track, interpret, and contextualize these movements, investors can gain a massive strategic advantage, identifying accumulation phases long before they materialize as sustained price trends.
The Mechanics: Source Methodology and Data Aggregation
To interpret ETF Flows accurately, one must first understand where the data originates. Unlike decentralized protocol statistics that are available in real-time on-chain, ETF data is reported through a multi-layered institutional pipeline.
The Role of Authorized Participants (APs)
- The heartbeat of an ETF is the creation and redemption process. When demand for an ETF share exceeds current supply, Authorized Participants step in. They purchase the underlying assets (BTC, ETH, or other future commodities) and deliver them to the ETF issuer in exchange for new shares.
- This "Creation" event is what we measure as an inflow. Conversely, when investors sell their shares en masse, the APs redeem those shares with the issuer, selling the underlying assets back to the open market, which manifests as an outflow.
Data Aggregation Challenges
- The data you see on institutional dashboards is an aggregate of these creation and redemption events across all licensed issuers (e.g., BlackRock, Fidelity, Ark). The primary source of truth is the daily disclosure provided by these issuers to the financial markets.
- However, because there are multiple venues and time zones involved, the data reported by different trackers can occasionally vary slightly based on the timestamp of the settlement. Institutional-grade analysts ensure their ETF Flows telemetry accounts for these slight settlement lags to avoid misinterpreting a simple administrative delay as a change in macro sentiment.
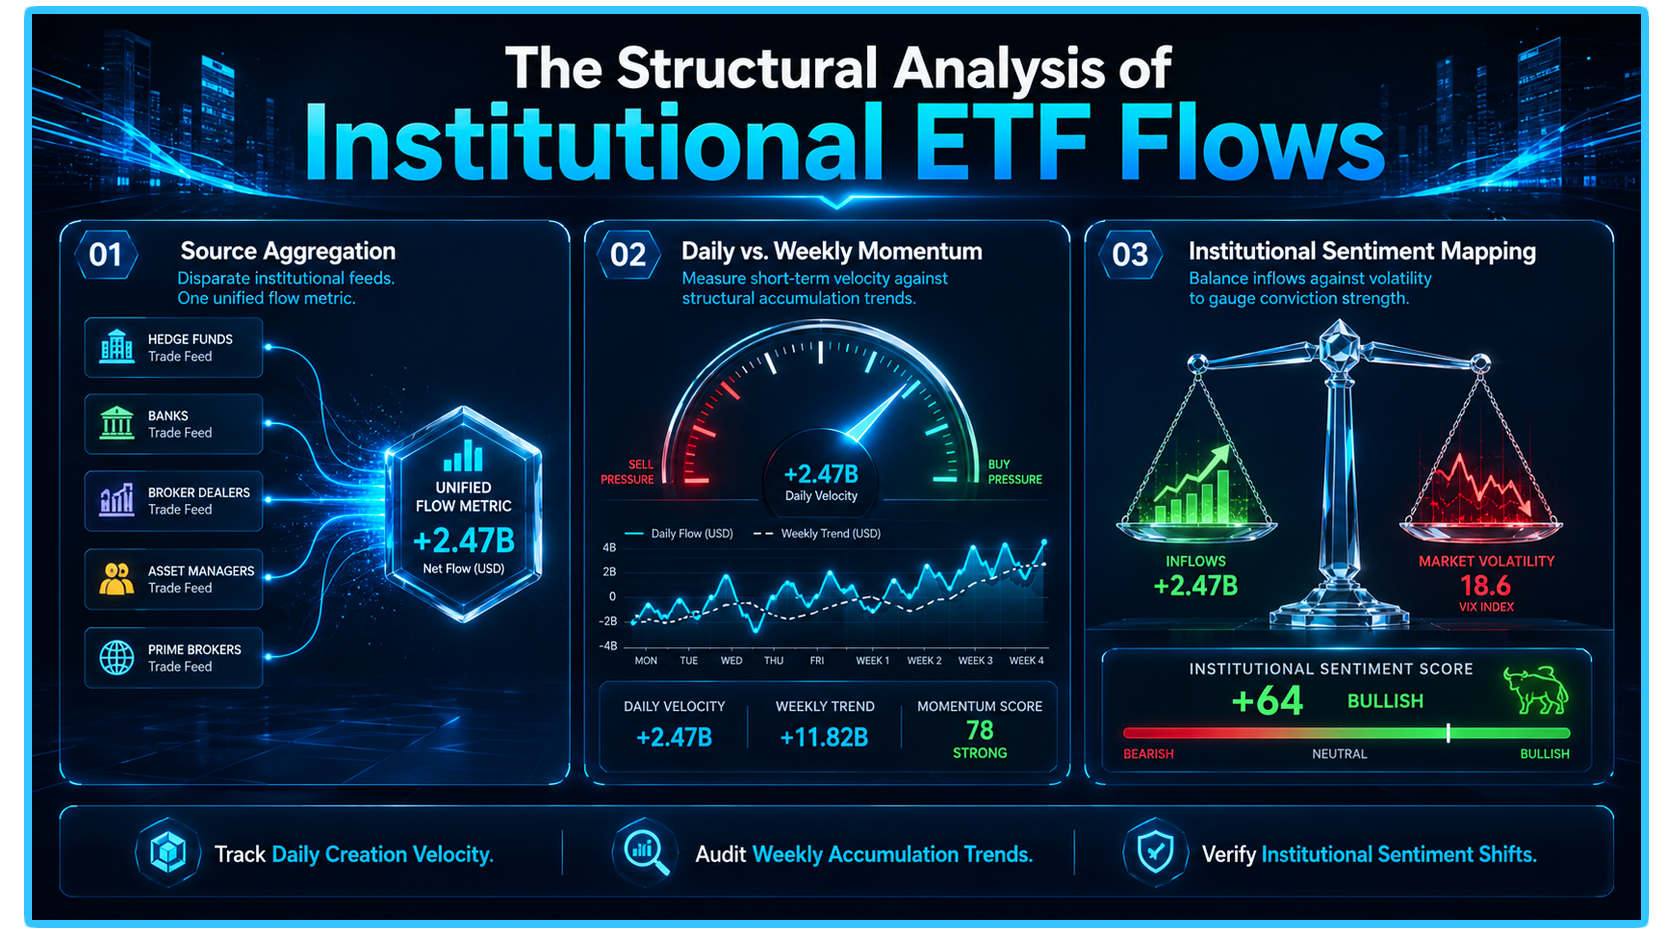
Reading the Data: Daily vs. Weekly Perspectives
Tracking ETF Flows without context is a recipe for volatility-induced decision making. The distinction between daily reporting and weekly trends is essential for separating "noise" from "signal."
The Daily Noise
- Daily inflow and outflow reports are often hyper-reactive. A single large institutional rebalancing or a hedge fund executing a basis-trade strategy can result in a massive single-day inflow that disappears the following day.
- If an investor adjusts their portfolio based on a single day of data, they are often falling victim to "market microstructure noise": short-term order book activity that does not represent a long-term change in institutional allocation.
The Weekly Trend Signal
- The weekly view is where the true narrative emerges. Institutional capital allocators rarely move their entire position in a single 24-hour window. Instead, they implement "Time-Weighted Average Price" (TWAP) or "Volume-Weighted Average Price" (VWAP) execution strategies, spreading their buys over days or weeks to avoid causing significant slippage in the underlying market.
- By looking at a 5-day or 10-day moving average of fund flows, you strip away the daily noise and reveal the genuine trajectory of institutional interest. A consistent streak of positive weekly inflows, regardless of the daily volatility, is a robust indicator of "smart money" accumulation.
Contextualizing Sentiment and Market Impact
- Tracking these institutional metrics is vital, but they must be contextualized alongside the broader market microstructure. An inflow is not always a bullish signal in isolation; it must be mapped against the price action.
- If we observe massive inflows during a period where the asset's price is failing to break above a key resistance level, it suggests that institutional buyers are aggressively soaking up liquidity from a specific seller, likely a whale or a major fund distributing their holdings. This indicates a "liquidity absorption" phase, where the market is preparing for a significant move once the supply overhang is cleared.
- Conversely, outflows during a market rally can signal that institutional profit-taking is occurring. By tracking the ETF Flows in tandem with technical indicators like volume profile and order book depth, you transform from a reactive trader into a proactive market participant.
Telemetry and Verification via DEXTools
- Even when analyzing institutional ETF products, verification remains the ultimate gatekeeper. Advanced market participants use tools like DEXTools to bridge the gap between institutional fund activity and decentralized liquidity.
- By monitoring pair activity, liquidity concentration, and real-time order book pressure on decentralized exchanges, you can verify if the institutional inflows recorded in the ETF sector are cascading into actual on-chain demand. DEXTools allows you to see the "other side" of the institutional trade, confirming that the underlying assets are indeed being utilized across the DeFi ecosystem.
- You can access DEXTools here and start trading today!
Disclaimer: This article is for informational purposes only and does not constitute investment advice, financial advice, trading advice, or any other kind of advice. DEXTools does not recommend buying, selling, or holding any cryptocurrency or token. Users should conduct their own research and consult with a qualified financial advisor before making any investment decisions. Cryptocurrency investments are volatile and high-risk. DEXTools is not responsible for any losses incurred.