Fibonacci Retracement in Crypto: Practical Examples

Legacy horizontal support lines often fail inside hyper-volatile crypto networks. We break down the exact algorithmic drawing rules and Golden Pocket liquidity clusters needed to trade market corrections safely.
The Sacred Geometry of Order Flow: Moving Past Arbitrary Support Lines
- The global marketplace for digital assets operates as an uninterrupted, 24/7 coliseum of pure crowd psychology. Because decentralized ledgers run without regional closure gates or circuit breakers, trends do not gently correct; they accelerate into intense emotional expansion runs and steep liquidation flushes. For retail participants, attempting to trade these high-velocity cycles using arbitrary, manually drawn support lines or speculative social media sentiment regularly leads to severe portfolio drawdowns. A horizontal line drawn carelessly across a random candle cluster provides zero statistical edge inside a market dominated by institutional algorithms and high-frequency liquidity desks.
- To uncover genuine structural order within this apparent chaos, professional market participants look behind the immediate price action. They evaluate the market using the principles of mathematical proportion and self-fulfilling behavioral templates. The most reliable, time-tested framework used to map these structural coordinates is the Fibonacci Retracement tool.
- Based on the recursive mathematical sequences uncovered in thirteenth-century Europe by Leonardo de Pisa, these ratios quantify a foundational law of natural expansion and contraction. When applied to modern crypto assets, Fibonacci levels act as a hidden map of the limit order book. They reveal exactly where algorithmic buy walls are programmed to absorb corrections, where retail stop-losses are clustered, and where profit-taking supply will manifest once an asset breaks out into open price discovery.
- Understanding the technical architecture of these geometric grids, mastering the exact drawing parameters required to eliminate human bias, and learning how to exploit high-probability liquidity zones is the definitive baseline for navigating crypto volatility cleanly.
1. The Architectural Blueprint: Understanding the Core Mathematical Levels
- To deploy the Fibonacci retracement grid with maximum precision, you must deconstruct what these percentages represent to an automated execution desk. A Fibonacci grid is not a static measuring tape; it is a dynamic scale that measures the exact depth of a market correction relative to its preceding directional impulse move. When an asset experiences a massive vertical run, the grid calculates specific percentages of that total distance, plotting horizontal coordinates where the market is statistically likely to seek equilibrium.
The universal industry standards divide the retracement matrix into five distinct functional thresholds:
The 23.6% Threshold (The Shallow Continuation)
This level represents an incredibly shallow correction. When an asset pulls back and holds the twenty-three point six percent line perfectly, it flags extraordinary underlying trend strength. It proves that institutional demand is so aggressive that buyers are unwilling to wait for a deeper discount, instantly absorbing incoming sell orders to force a rapid continuation of the vertical run.
The 38.2% Threshold (The First Healthy Base)
The thirty-eight point two percent coordinate serves as the first logical support station during a routine market pull-back. In a standard, sustainable bull market expansion, assets frequently execute brief corrections down to this layer to clear out late-stage, over-leveraged intraday long positions before safely resuming the macro uptrend.
The 50.0% Threshold (The Equilibrium Axis)
It is vital for technical analysts to recognize that the fifty percent line is not a true mathematical Fibonacci ratio fraction. Instead, it is derived from foundational Dow Theory market mechanics, which state that an asset undergoing a correction will naturally seek an exact halfway equilibrium point between its historical breakout low and its local peak. When a token stabilizes at this axis, it signals perfect structural balance between supply and demand.
The 61.8% Threshold (The Golden Ratio Gateway)
The sixty-one point eight percent boundary is the mathematical cornerstone of the entire indicator framework. Derived directly from the Golden Ratio found throughout universal natural structures, this coordinate marks the definitive line separating a healthy, temporary corrective pullback from a total structural trend breakdown.
The 78.6% Threshold (The Final Defensive Gate)
The seventy-eight del point six percent level represents a deeply discounted correction zone. This coordinate acts as the final defensive gate for trend-following allocators. If an asset slips below this floor, the entire preceding impulse move is structurally invalidated, confirming that the trend has completely reversed from bullish expansion to systemic macro distribution.
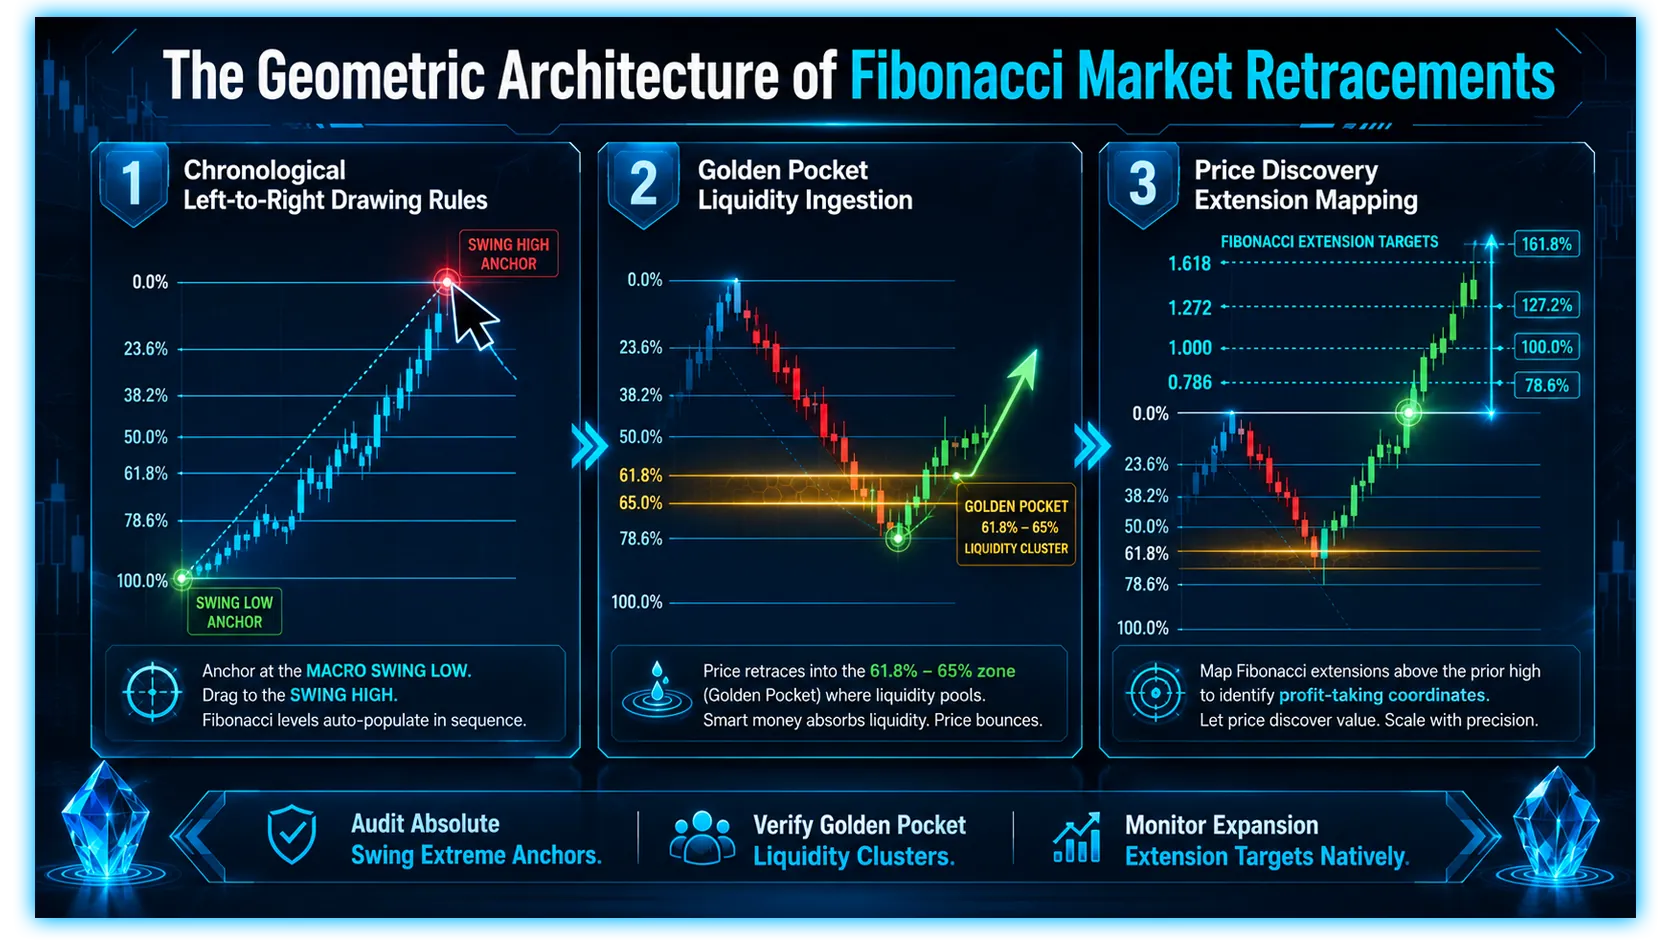
2. The Golden Pocket: Exploiting Institutional Liquidity Clusters
While the default technical textbooks instruct retail traders to place individual buy orders directly on the standalone sixty-one point eight percent line, professional quantitative traders operate within a highly specialized zone known as the Golden Pocket.
The Anatomy of the Golden Pocket Zone
The Golden Pocket is a tight geometric channel bound between the 61.8% retracement level and the 65.0% coordinate (a specialized level derived from the square root of the Golden Ratio). In crypto market microstructure, this specific pocket operates as an immense liquidity vortex.
When an asset slides down into this zone during a market-wide downcycle, a predictable behavioral feedback loop activates:
The Retail Stop-Loss Hunt: Amateurs who entered long positions early in the trend typically stack their protective stop-loss market orders directly beneath the visible sixty-one point eight percent line.
The Algorithmic Absorption: Institutional market makers and automated whale accumulation scripts program their buy limit orders to sit slightly deeper, precisely inside the sixty-one point eight to sixty-five percent pocket.
The Liquidity Event: As the asset price drops through the sixty-one point eight percent floor, it triggers a cascading waterfall of retail stop-losses. This forced market selling injects an immense wave of liquid spot supply straight into the order book. The institutional algorithms sitting in the Golden Pocket instantly absorb this supply, filling their size at an optimized discount before aggressively driving the spot price back upward in a violent V-shaped mean-reversion bounce.
By aligning your entry scripts to trigger exclusively within this pocket, you align your capital flow directly alongside institutional accumulators, capturing exceptional entry pricing while mitigating your exposure to early false support bounces.
3. The Absolute Drawing Rules: Eliminating Subjective Human Bias
The primary reason why retail traders conclude that Fibonacci retracements "do not work" is because they draw their grids arbitrarily, bending the tool to fit a personal bias rather than conforming to strict architectural rules. To ensure your grid coordinates line up with institutional execution desks, you must enforce a non-negotiable plotting protocol.
Rule 1: The Chronological Left-to-Right Mandate
You must always anchor and draw your Fibonacci tool strictly from Left to Right chronologically across the timeline chart.
For a Bullish Retracement (Buying the Dip): Click your initial anchor point precisely on the absolute structural Swing Low of the move, and drag the cursor forward in time to lock the secondary anchor on the absolute Swing High of the peak.
For a Bearish Retracement (Shorting the Relief): Click your first anchor on the macro Swing High of the breakdown origin, and drag the grid forward to lock the second anchor on the ultimate Swing Low of the capitulation bottom.
Failing to draw from left to right reverses the percentage data channels, projecting erroneous support baselines that are entirely invisible to automated matching engines.
Rule 2: The Wick-to-Wick Standard
- A source of continuous confusion across trading communities is whether to anchor the Fibonacci grid to the closing bodies of the candlesticks or to the absolute outer tips of the wicks.
- Inside legacy equity environments, some analysts ignore wicks due to low overnight liquidity anomalies. However, inside the hyper-leveraged, 24/7 crypto sandbox, ignoring the wicks is an unmitigated operational error. Crypto wicks represent real-world executed prices, massive forced margin liquidations, and the exact physical boundaries where market maker capital stepped in to halt a directional push. Therefore, professional crypto allocators anchor their grids meticulously from the absolute pixel-tip of the highest wick to the absolute pixel-tip of the lowest wick.
4. Extensions: Mapping Profit-Taking Targets in Price Discovery
- While retracement levels are engineered to track the depth of a downward correction, Fibonacci Extensions serve a completely different strategic purpose. Extensions are calculated to map out future upside targets when an asset breaks completely above its previous historical all-time high and enters Price Discovery.
- When a token enters price discovery, there are no past horizontal resistance lines or historical volume profiles available on the chart to guide your exits. Under these conditions, the market enters a psychological vacuum. Retail traders become blinded by greed and refuse to sell, while institutional desks rely on automated extension ratios to systematically scale out of their positions.
The most vital institutional extension targets include:
The 1.618 Extension (The Primary Target Gateway)
The one point six one eight extension represents the first major milestone of a macro breakout run. When an asset clears its old high and accelerates upward, the one point six one eight extension acts as a heavy psychological take-profit ceiling where early accumulators routinely lock in significant capital gains, often forcing a multi-day consolidation pause.
The 2.618 Extension (The Parabolic Exhaustion Threshold)
If the underlying asset is backed by immense structural network inflows and a powerful narrative trend, the price momentum will easily pierce through the first target to shoot toward the two point six eight extension line. This coordinate represents a state of extreme parabolic acceleration. At this threshold, the asset's valuation is heavily overextended relative to its historical parameters, marking a high-conviction zone to aggressively scale out of long-term allocations.
The 4.236 Extension (The Macro Cycle Terminal Ceiling)
The four point two three six extension is the ultimate terminal boundary line of a macro bull market cycle. It represents absolute vertical mania and peak retail FOMO. When a crypto token hits this line after an extended multi-month expansion run, the probability of a structural trend collapse increases drastically, making it a critical zone to finalize profit realization scripts.
Fibonacci Technical Retracement Levels
| Retracement Level | Structural Market Meaning | Algorithmic Status |
| 23.6% | Extremely Shallow Correction | Aggressive Momentum Continuation |
| 38.2% | Standard Healthy Pullback | Common Swing Trading Re-entry |
| 50.0% | Dow Theory Equilibrium Axis | Balanced Market Centerpoint |
| 61.8% - 65.0% | The Golden Pocket Vortex | Institutional Liquidity Magnets |
| 78.6% | Final Macro Defensive Gate | Critical Trend Invalidation Floor |
Fibonacci Price Discovery Extensions
| Extension Target | Mathematical Value | Portfolio Operational Action |
| 1.618 Extension | Primary Breakout Milestone | Initiate Initial Scale-Out Profits |
| 2.618 Extension | Parabolic Acceleration Cap | Aggressive Profit Realization Gate |
| 4.236 Extension | Cycle Terminal Exhaustion | Finalize Complete Capital Exits |
5. Integrating Telemetry Auditing via DEXTools
- As you secure your seed phrase storage and hardware wallet setup, maintaining visibility over decentralized markets remains essential. DEXTools provides advanced analytics to monitor live token behavior, liquidity pools, contract data, and market activity across public blockchain networks.
- With tools like Pair Explorer, Live New Pairs, Trade Story, Top Traders, and Big Swap Explorer, traders can audit volume trends, track whale movements, review liquidity depth, and check contract safety before interacting on-chain. This helps ensure secured wallets engage only with verified and liquid market venues while private keys remain safely protected offline.
You can access DEXTools here and start trading today!
Disclaimer: This article is for informational purposes only and does not constitute investment advice, financial advice, trading advice, or any other kind of advice. DEXTools does not recommend buying, selling, or holding any cryptocurrency or token. Users should conduct their own research and consult with a qualified financial advisor before making any investment decisions. Cryptocurrency investments are volatile and high-risk. DEXTools is not responsible for any losses incurred.