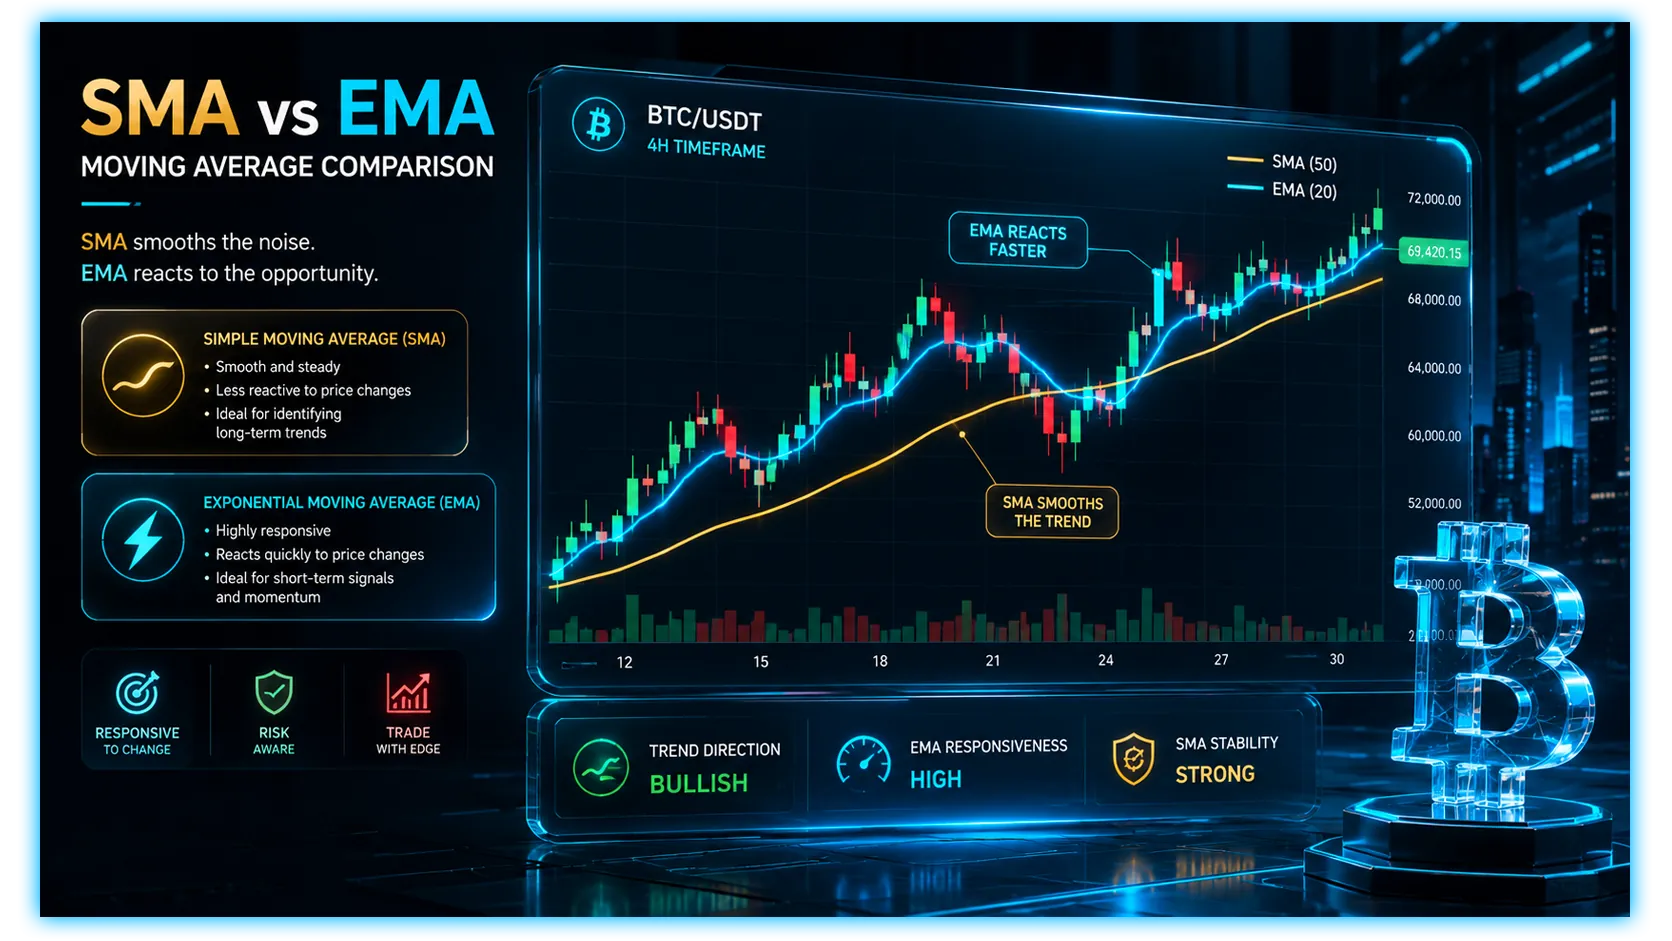
EMA vs SMA: Which Moving Average to Use in Crypto

Candlestick charts generate severe visual noise and false breakout traps inside volatile crypto networks. We break down the data weighting mechanics needed to choose between EMA and SMA.
The Smooth Illusion: Navigating Trend Telemetry in Volatile Markets
- In global decentralized asset networks, raw price action operates as a continuous, high-amplitude negotiation between aggressive capital accumulation and systemic market distribution. Because digital assets trade on an uninterrupted 24/7/365 liquidity grid entirely driven by borderless human psychology, algorithmic execution scripts, and structural supply-demand shocks, macro market trends are highly prone to sudden, violent distortions. A standard, unfiltered candlestick chart records the nominal sequence of historical execution ticks across defined timeframes.
- However, looking at raw candles in isolation often introduces severe visual noise. Sudden, leverage-driven liquidation cascades can paint dramatic downward wicks that trigger panic selling across retail trading communities, even when the underlying structural health of the network remains fully intact. Conversely, a brief, manufactured thin-order-book short squeeze can create an illusion of an explosive macro breakout expansion, right before the price reverses violently and traps late-stage buyers at the absolute local peak of the market cycle.
- To strip away this intraday technical static and look clearly at the overarching market cycle, professional quantitative analysts and digital asset allocators rely on moving averages. A moving average functions as a low-pass data filter. It aggregates a specified block of historical closing prices, smooths out the erratic, short-term wicks, and outputs a continuous trend line that maps the true direction and velocity of the market.
- This guide untangles the structural architecture of both indicators, profiles their behavioral differences inside the hyper-volatile crypto market, establishes a tactical playbook for multi-timeframe deployment, and outlines defensive risk mitigation guardrails.
1. The Simple Moving Average (SMA): The Institutional Structural Anchor
- To deploy moving averages with a genuine mathematical edge, you must look past the superficial lines on your terminal and understand how the underlying software script processes historical ledger entries. The most foundational, time-tested variation is the Simple Moving Average.
- The operational architecture of the SMA is defined by absolute data equality. To calculate an SMA, the script takes the closing prices of an asset over a specific number of lookback periods, adds them together, and divides that cumulative total by the number of periods in the window. As a fresh candle closes on the chart, the oldest data point inside the lookback block is dropped from the calculation entirely to accommodate the new execution data.
- The defining characteristic of the SMA is its unyielding commitment to uniform historical weighting. A closing price that occurred fifty days ago in the middle of a quiet consolidation range influences the current trajectory of a 50-day SMA exactly as much as an explosive, high-volume candle that materialized today.
- Because of this rigid, equal-weight design philosophy, the SMA behaves as a heavy, highly stabilized, and slow-reacting baseline. It is inherently non-reactive to sudden, short-term price fluctuations, allowing it to function as an exceptional institutional trend anchor across major macro cycles.
- However, this high stability introduces a significant operational trade-off: Lag. Because the SMA treats all historical datasets identically, it exhibits a structural delay when reacting to sudden, real-time macro trend reversals. By the time a long-term SMA curves upward and logs a definitive directional change, an aggressive market expansion may have already moved significantly off its cycle bottom, forcing conservative trend-following traders to buy into the trend later than faster, momentum-based market participants.
2. The Exponential Moving Average (EMA): The Tactical Velocity Tracker
- To resolve the structural delay inherent in equal-weight averaging models, technical analysts deploy the Exponential Moving Average. The EMA completely discards the concept of uniform historical data weighting, replacing it with a geometric smoothing framework that prioritizes near-term market velocity.
- Instead of assigning identical significance to all candles within the chosen lookback block, the EMA applies a mathematical multiplier that grants exponentially higher weight to the most recent closing prices. As the data moves backward in time, its overall influence on the current value of the moving average decays exponentially, eventually approaching a near-zero weighting margin at the furthest boundary of the lookback history.
- Because the calculation loop heavily weights today's live price ticks relative to historical averages, the EMA functions as a hyper-reactive, low-latency trend tracker. It hugs the active price action significantly closer than a matching SMA, instantly altering its path to reflect real-time capital injections, sudden stablecoin printing surges, and cascading liquidation wicks.
- The core advantage of the EMA is its ability to provide early warning telemetry. When an asset enters a violent, high-volume breakout phase, the EMA detects the acceleration immediately, curving upward days before a standard SMA registers the shift. This agility allows tactical traders to secure highly optimized entry prices early in an expansionary cycle and exit positions rapidly at the first sign of structural momentum breakdown.
- Yet, this extreme responsiveness uncovers its own severe operational vulnerability: Noise Sensitivity. Because the EMA is highly sensitive to near-term price changes, it is heavily exposed to false breakout traps. A brief, speculative whale order or an erratic algorithmic stop-loss hunt can easily cause the EMA line to whip upward or downward, flagging a premature trend verification signal that completely disappears once the market returns to its baseline consolidation range.
3. The Cryptographic Landscape: Volatility, Leverage, and Whipsaws
While selecting an appropriate moving average configuration is an ordinary task in legacy equity or commodity markets, executing this choice inside the decentralized crypto sandbox requires analyzing unique market microstructures. The 24/7/365 nature of public blockchain ledgers paired with high structural leverage availability across perpetual swap markets alters how moving averages behave under stress.
The Leverage-Driven Wick Problem
Crypto asset markets experience frequent, violent liquidation events often referred to as "scam wicks." When a high volume of retail long positions builds up across perpetual swap desks, a minor downward price adjustment can trigger cascading automated margin liquidations. This forces thousands of accounts to market-sell their assets simultaneously, causing the spot price to plunge vertically over a multi-minute window before market makers can absorb the order flow and bid the asset straight back to its original price floor.
This structural reality exposes the core behavioral contrast between the two moving averages:
The EMA Reaction: Because the EMA is heavily weighted toward the most recent candles, a temporary liquidation wick causes the line to bend sharply downward. An automated strategy or trading bot tied strictly to an EMA crossing checkpoint can be tricked into interpreting this temporary anomaly as a terminal trend breakdown, forcing you to close your spot allocations at the absolute bottom of a manipulation wick.
The SMA Isolation: The slow-moving SMA remains steady through the chaos. Because it views the flash-liquidation wick as merely one single entry among a massive block of equal-weight historical periods, it isolates the noise seamlessly, maintaining its structural trajectory and preventing unnecessary stop-out executions.
4. The Tactical Playbook: How to Position and Combine Both Baselines
Because both moving averages possess unique structural strengths and vulnerabilities, professional digital asset allocators do not treat them as mutually exclusive options. Instead, they pair them together across distinct timeframes to build a comprehensive, multi-tiered trend verification matrix.
The Macro Structural Tracks: Standardizing the SMA
For high-level macro analysis, trend indexing, and long-term spot portfolio management, the Simple Moving Average is the undisputed industry standard. Specifically, the 50-day SMA and the 200-day SMA serve as vital institutional reference points across global financial trading desks.
The Golden Cross: A major bull market validation signal that manifests when the medium-term 50-day SMA breaks decisively above the long-term 200-day SMA from below, proving that structural accumulation has overridden historical distribution.
The Death Cross: A severe defensive warning signal that triggers when the 50-day SMA cuts down through the 200-day SMA, confirming that a systemic bear market cycle is preparing to settle over the ecosystem.
Because thousands of institutional funds, algorithmic market makers, and large OTC desks track these exact SMA lines globally, they function as self-fulfilling psychological support and resistance zones. When an asset like Bitcoin pulls back to test its 200-day SMA during an active bull run, massive buy walls naturally materialize, making it an excellent baseline to identify generational accumulation entry zones.
The Local Execution Tracks: Maximizing the EMA
For shorter-term derivative trading, high-beta altcoin swing trading, and fast-paced intraday executions, the Exponential Moving Average is the superior technical framework. Traders heavily favor shorter lookback sequences like the 9-period EMA, 21-period EMA, and 50-period EMA on the 1-hour and 4-hour charts.
The Dynamic Support Ribbon: During an aggressive, parabolic upward run, an asset's price will consistently use the fast-moving 9 or 21 EMA as a dynamic support trampoline. As long as the candles close cleanly above the EMA line on the 4-hour chart, the vertical momentum is intact.
The Acceleration Trigger: When an altcoin consolidates sideways for weeks and suddenly experiences a bullish crossover where the 9 EMA cuts cleanly above the 21 EMA on high volume, it signals that near-term buying acceleration has seized control of the order book, providing a high-probability trigger to enter momentum positions before the breakout achieves broad public visibility.
Moving Average Component Frameworks
| Metric Attribute | Simple Moving Average (SMA) | Exponential Moving Average (EMA) |
| Data Weighting | 100% Equal Weight | Weighted Recent Multiplier |
| Reaction Latency | High Lag / High Stability | Low Lag / High Sensitivity |
| Core Vulnerability | Delayed Entry & Exit Signals | High Exposure to False Whipsaws |
Crypto Timeframe Operational Matrix
| Moving Average | Lookback Period | Strategic Deployment Track |
| EMA | 9 & 21 Periods | Short-Term Momentum Execution |
| EMA / SMA | 50 Periods | Medium-Term Swing Core Support |
| SMA | 200 Periods | Long-Term Macro Cycle Boundary |
5. Real-Time Telemetry Verification Sourcing via DEXTools
- As you secure your seed phrase storage and hardware wallet setup, maintaining visibility over decentralized markets remains essential. DEXTools provides advanced analytics to monitor live token behavior, liquidity pools, contract data, and market activity across public blockchain networks.
- With tools like Pair Explorer, Live New Pairs, Trade Story, Top Traders, and Big Swap Explorer, traders can audit volume trends, track whale movements, review liquidity depth, and check contract safety before interacting on-chain. This helps ensure secured wallets engage only with verified and liquid market venues while private keys remain safely protected offline.
You can access DEXTools here and start trading today!
Disclaimer: This article is for informational purposes only and does not constitute investment advice, financial advice, trading advice, or any other kind of advice. DEXTools does not recommend buying, selling, or holding any cryptocurrency or token. Users should conduct their own research and consult with a qualified financial advisor before making any investment decisions. Cryptocurrency investments are volatile and high-risk. DEXTools is not responsible for any losses incurred.