How Many ETH Are There? Ethereum Supply Guide 2026
— By AliceOnChain in Tutorials

How many ETH are there in 2026? Full breakdown of Ethereum's 120.5M supply, EIP-1559 burn, staking, ETF holdings and post-Merge dynamics.
The question sounds simple. How many ETH are there? But unlike Bitcoin's hard-capped 21 million coins, Ethereum's supply is a living, breathing number that shifts with every block. As of May 2026, roughly 120.5 million ETH exist on the network, yet that figure can rise or fall depending on how much activity the chain processes on any given day.
This dynamic supply model is the result of two opposing forces working against each other: validator issuance creating new ETH to secure the network, and the EIP-1559 fee burn destroying ETH with every transaction. When activity is high, more ETH is burned than created, and the supply actually shrinks. When activity cools, supply slowly grows. Ethereum proponents call this "ultrasound money," a reference to Bitcoin's "sound money" branding.
This guide breaks down exactly how many ETH exist today, where every coin came from since the 2015 Genesis block, how the post-Merge supply curve actually works, why staked and illiquid ETH dramatically reduce circulating supply, and how institutional accumulation through ETFs is reshaping the market. By the end, you will understand Ethereum's tokenomics better than most analysts who only quote a static number from CoinMarketCap.
How Many ETH Are There Right Now?
As of May 2026, the total ETH supply sits at approximately 120.52 million coins. This figure is the canonical answer to "how many ETH are there," but the number you see on any given block explorer can differ by a fraction depending on the exact block being queried. Ethereum produces a new block roughly every 12 seconds, and each block can mint or burn ETH, so the supply ticker is in constant motion.
For perspective, Bitcoin currently has around 19.85 million BTC in circulation. Ethereum has roughly six times the coin count, but because each ETH is divisible into 10^18 wei (Bitcoin uses 10^8 satoshis per coin), raw count comparison matters less than market cap. What matters is the rate of change and distribution.
The "circulating supply" you see on most data sites is usually identical to total supply for Ethereum, because there is no founder vesting cliff, no pre-mine reserve drip, and no escrow contract holding back coins. Every ETH that exists is technically circulating, even when it is staked or sitting in a cold wallet. This is meaningfully different from projects like Solana, XRP, or Avalanche, where significant portions of supply are still locked in vesting schedules years after launch.
Why Ethereum Has No Hard Cap (And Why That Is Intentional)
Bitcoin's 21 million cap is a hard rule baked into Satoshi's original code. Ethereum took the opposite philosophical stance. Vitalik Buterin and the early Ethereum researchers argued that a hard cap forces the security budget (the rewards paid to miners or validators) to eventually shrink to zero, which could compromise network security in the very long term. Instead, Ethereum opted for "minimum viable issuance," a sliding scale where new ETH is created only at the rate required to keep the validator set economically motivated.
The actual issuance formula is based on the total amount of ETH staked. As more ETH is staked, issuance per validator decreases, but the total network issuance increases at a square-root rate. At 33 million ETH staked, the protocol issues roughly 900,000 new ETH per year, which is approximately 0.75% annual inflation before accounting for burns. This is dramatically lower than the proof-of-work era, when issuance ran at 4-5% per year, and orders of magnitude lower than traditional fiat currencies.
The trade-off is that Ethereum's monetary policy is technically more flexible. A hard cap is a binding constitutional rule. Ethereum's issuance curve can be changed through governance and protocol upgrades. In practice, however, the Ethereum community has been extremely conservative about issuance changes, and every modification since 2015 has either reduced issuance or made it more predictable.
The History of ETH Supply: From Genesis to Today
To truly understand how many ETH are there, you need to walk through how every coin entered circulation. The supply timeline breaks neatly into four distinct eras, each with its own monetary policy.
Era 1: The Genesis Block (July 30, 2015)
Ethereum launched with a Genesis block that pre-minted exactly 72,009,990.50 ETH. This pre-mine was distributed in three main pools: about 60 million ETH went to participants of the 2014 crowdsale (the famous pre-sale that raised 31,591 BTC, worth roughly $18.4 million at the time), 6 million ETH went to early contributors and the Ethereum development team, and another 6 million ETH was allocated to the long-term endowment of the Ethereum Foundation.
This Genesis allocation has been the subject of plenty of debate over the years, but it is fully transparent and verifiable on chain. Anyone can query the Genesis block on Etherscan and see every wallet that received initial coins. Vitalik Buterin himself received approximately 553,000 ETH in the initial distribution, a holding he has gradually reduced through donations and sales over the years.
Era 2: Proof-of-Work Mining (2015-2022)
For the first seven years of its existence, Ethereum used proof-of-work consensus, similar to Bitcoin. Miners ran specialized hardware to solve cryptographic puzzles, and the winning miner received a block reward in newly minted ETH. The block reward started at 5 ETH per block in 2015 and was gradually reduced through hard forks: down to 3 ETH with Byzantium (October 2017), then to 2 ETH with Constantinople (February 2019).
Over the proof-of-work era, miners created approximately 48 million ETH through block rewards and uncle rewards. At its peak in 2018, the network was issuing more than 7 million ETH per year, an annual inflation rate of roughly 7.5%. By the time of the Merge, total supply had grown to approximately 120 million ETH, with proof-of-work being the largest single source of new supply over Ethereum's history.
Era 3: EIP-1559 and the Burn Begins (August 5, 2021)
EIP-1559 was activated on August 5, 2021, as part of the London hard fork. This upgrade fundamentally changed how transaction fees work on Ethereum. Before EIP-1559, users paid a single gas price to miners, who would prioritize the highest bidders. After EIP-1559, every transaction includes a "base fee" that adjusts dynamically based on network congestion, and that base fee is burned, meaning the ETH is sent to an address from which it can never be retrieved. Users can also add an optional "priority fee" tip that goes to validators.
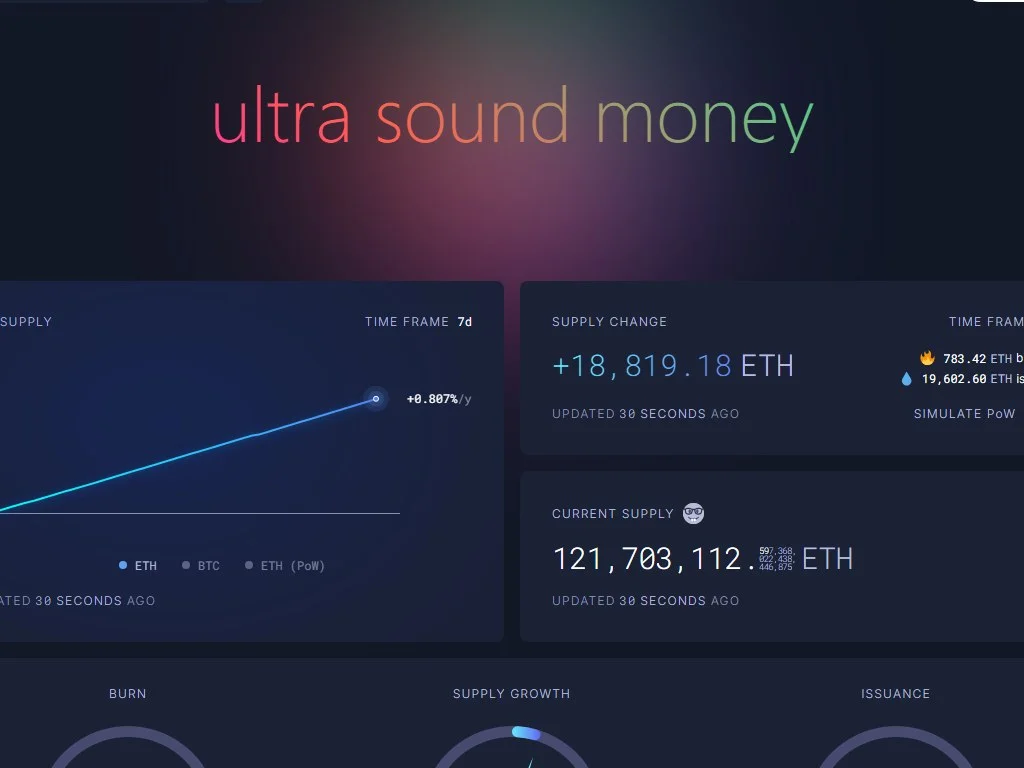
The burn mechanism turned every transaction into a small deflationary event. Since activation, EIP-1559 has burned more than 4.65 million ETH, worth tens of billions of dollars at current prices. The burn rate varies massively with network activity. During the 2021 NFT mania, the network burned more than 10 ETH per minute. During quieter periods, the burn drops to less than 1 ETH per minute. The dashboard at ultrasound.money tracks this in real time, and it has become one of the most-watched metrics in the entire Ethereum ecosystem.
Era 4: The Merge and Proof-of-Stake (September 15, 2022)
The Merge permanently switched off proof-of-work mining. Issuance dropped by approximately 90% overnight, from roughly 13,000 ETH per day under PoW to about 1,700 ETH per day under PoS. This was the largest single reduction in cryptocurrency issuance ever, dubbed "the Triple Halving" because it had the supply impact of three consecutive Bitcoin halvings on a single day.
Combined with the EIP-1559 burn, the Merge meant Ethereum's net supply growth could realistically be zero or negative for the first time. Total supply peaked at around 120.53 million ETH in mid-September 2022, then declined for several months as burn exceeded issuance. The trend has stayed remarkably flat since, which is precisely what the "ultrasound money" thesis predicted. For broader context, see our complete Ethereum guide for 2026.
How EIP-1559 Burn Works: The Mechanism in Detail
The EIP-1559 burn is the most important supply mechanic on Ethereum, so it is worth unpacking exactly how it works. Every Ethereum transaction consumes "gas," a unit that measures computational effort. A simple ETH transfer uses 21,000 gas. A complex DeFi swap might use 200,000 gas. An NFT mint can use 300,000 gas or more.
The total fee for any transaction is calculated as gas_used * (base_fee + priority_fee). The base fee is set algorithmically by the protocol based on how full the previous block was. If the previous block was more than half full, the base fee for the next block increases. If it was less than half full, the base fee decreases. This creates a smooth, predictable adjustment that prevents the wild gas price spikes of the pre-1559 era.
The base fee portion of every transaction is permanently destroyed. The priority fee goes to the validator who proposes the block. This means high network activity does two things simultaneously: it raises the base fee (making each transaction burn more ETH), and it processes more transactions per second (so more transactions are burning ETH). Both effects compound, which is why the network can burn ETH faster than validators can create it during peak demand. For a deeper dive on transaction costs, our gas price and gwei guide covers the topic in full.
Post-Merge Supply Curve: Issuance vs Burn
The dynamic interaction between proof-of-stake issuance and EIP-1559 burn defines Ethereum's modern monetary policy. Let us look at the numbers in detail. Proof-of-stake issuance follows a known formula based on the total amount of ETH staked. The exact equation involves a square root, but the simplified takeaway is this: as more ETH is staked, total annual issuance grows, but the yield per individual validator shrinks.
At 14 million ETH staked (the level shortly after the Merge), issuance was about 600,000 ETH per year. At 30 million ETH staked, issuance grew to roughly 875,000 ETH per year. At 33 million ETH staked (today's level), issuance is approximately 920,000 ETH per year. This means the gross issuance rate is around 0.76% per year before any burn is subtracted.
The burn varies wildly. During the 2024 memecoin frenzy, the network burned more than 3 million ETH on an annualized basis. During quiet weeks in early 2026, the annualized burn dropped to around 400,000 ETH. The result is that net supply growth has bounced between negative 1.5% (deflationary) and positive 0.4% (slightly inflationary) depending on the period. The 12-month rolling average has stayed close to zero, fulfilling the ultrasound money thesis.
The Staked ETH Story: 33 Million Coins Off the Market
One of the most important dimensions of Ethereum's supply story is staking. Approximately 33.1 million ETH are currently locked in the Beacon Chain deposit contract, representing about 27.5% of all ETH in existence. This is the single largest functional reduction in tradable supply that the network has experienced.
Staked ETH is not the same as gone forever. Validators can withdraw their stake (after a queue), and stakers can use liquid staking derivatives to maintain liquidity. But the practical effect is that 33 million coins are functionally illiquid, supporting network security rather than sitting on order books waiting to be sold. To get a deeper understanding of liquid staking specifically, see our Rocket Pool and rETH guide.
The composition of staked ETH is critical for understanding decentralization risk. The breakdown looks roughly like this in 2026:
Liquid staking has become the dominant category because it solves a fundamental UX problem. When you stake ETH directly, your coins are locked. With liquid staking, you receive a derivative token (like stETH or rETH) that you can use across DeFi while your underlying ETH earns rewards. This means stakers can have their cake and eat it too, which is why liquid staking has grown so aggressively since the Shanghai upgrade in April 2023 enabled withdrawals.
Illiquid Supply: Where Most ETH Actually Sits
Beyond the 33 million staked ETH, a much larger portion of supply qualifies as functionally illiquid. Analysts at Glassnode and CryptoQuant track on-chain age distribution to estimate how much ETH has not moved in long periods. Coins that have stayed in the same wallet for more than 12 months are typically classified as "illiquid" or "long-term holder supply" because the historical pattern shows those coins are extremely unlikely to be sold quickly.
As of mid-2026, approximately 56 million ETH have not moved in more than a year. That includes the staked ETH, but also covers DeFi collateral (ETH locked in Aave, Compound, MakerDAO, and others), ETH held by long-term whales, ETH in lost wallets, and the Ethereum Foundation treasury. When you sum all these illiquid categories, less than 35% of total supply is realistically available to trade in the short term.
This matters for price action. When demand surges, exchanges have a limited supply to satisfy buyers. The lower the available supply, the more price has to rise to attract sellers willing to part with their coins. This dynamic is why on-chain analysts watch exchange balances so closely. They are leading indicators for potential supply shocks.
Exchange Supply at Multi-Year Lows
The amount of ETH sitting on centralized exchanges has been declining for nearly four years. In early 2020, more than 25 million ETH lived on exchange wallets. By the time of the Merge in September 2022, that had dropped to around 18 million. As of May 2026, exchange balances sit at approximately 11.2 million ETH, the lowest level since 2018.
This decline reflects several trends. First, the rise of self-custody as users got burned by exchange failures like FTX, Celsius, and BlockFi. Second, the growth of DeFi as a destination for productive ETH (collateral, liquidity provision, staking). Third, the impact of ETF approvals, where institutional ETH is increasingly held by qualified custodians rather than sitting on retail exchanges. Fourth, the migration of trading activity from centralized exchanges to decentralized exchanges, which our Uniswap V4 hooks guide explores in depth.
Low exchange balances are a structural bullish signal because they limit the supply available for short-term selling. Combined with passive ETF demand and continued staking growth, the market structure for ETH is increasingly tight.
Institutional ETH: The ETF Effect
The launch of spot Ethereum ETFs in July 2024 was a watershed moment for ETH supply dynamics. For the first time, traditional institutional investors could gain ETH exposure through familiar brokerage accounts without ever touching a private key. The ETFs are required to hold physical ETH to back their shares, which means every dollar of ETF inflows directly translates into ETH being removed from open markets and locked in cold storage.
As of May 2026, the major spot Ethereum ETFs collectively hold approximately 5.4 million ETH, equivalent to about 4.5% of total supply. The biggest players include BlackRock's iShares Ethereum Trust (ETHA), Fidelity's Ethereum Fund (FETH), Grayscale's Ethereum Trust (ETHE) and Mini Ethereum Trust (ETH), Bitwise Ethereum ETF (ETHW), Franklin Templeton's EZET, VanEck's ETHV, and 21Shares Core Ethereum ETF (CETH). Together, these products have absorbed inflows that are running at roughly 35-50% of new ETH issuance, mechanically tightening the float.
Corporate treasuries have also begun adding ETH. MicroStrategy expanded its bitcoin strategy to include ETH in 2025 (accumulating more than 380,000 ETH), with Coinbase, Galaxy Digital, and various Asian-listed entities following suit. Identifiable corporate treasury holdings now exceed 700,000 ETH.
Ethereum Foundation, Vitalik, and Notable Holders
The Ethereum Foundation treasury, fully transparent on-chain, holds approximately 240,000 ETH as of May 2026, plus around $750 million in non-ETH assets. The Foundation has historically sold small batches (1,000-15,000 ETH) to fund operations, research grants, and developer programs. These sales are tracked by the community but represent a tiny fraction of total supply.
Vitalik Buterin's main public wallet currently holds around 240,000 ETH, having distributed substantial portions of his original Genesis allocation through donations (most famously, the $1 billion+ SHIB and Akita donations to GiveDirectly and others in 2021). Other concentrated holders include Coinbase Custody (which holds ETH for ETF issuers), Kraken and Binance cold wallets, Lido's smart contracts holding staker deposits, and original 2014 crowdsale buyers who have never moved their coins.
Step-by-Step: How to Verify ETH Supply Yourself
You do not have to take any data provider's word for it. Ethereum's supply is fully verifiable on chain. Here is how to check the numbers yourself.
eth_getBalance JSON-RPC call returns any wallet's exact balance.If you want to track real-time market dynamics tied to supply changes, DEXTools provides live pair-level analytics for the most heavily traded ETH pools across decentralized exchanges. Watching how ETH/USDT, ETH/USDC, and ETH-paired liquidity moves can give you early signals about supply tightness even before it shows up in exchange balance metrics.
Ethereum Supply vs Bitcoin Supply: The Real Comparison
The default comparison is "Bitcoin has 21M cap, Ethereum has no cap, so Bitcoin is more sound." But the reality is much more nuanced once you account for actual issuance rates, burn mechanics, and float dynamics.
The key takeaway is that despite having no hard cap, Ethereum's net issuance over the past year has actually been lower than Bitcoin's. This is the foundation of the ultrasound money argument. A hard cap is a sufficient condition for low inflation, but it is not a necessary one. Properly designed adaptive issuance combined with usage-driven burn can deliver an equivalent or better monetary regime.
Supply Projections Through 2030
Predicting future ETH supply requires assumptions about three variables: validator participation (how much ETH stays staked), network activity (how much ETH gets burned), and any upcoming protocol changes (such as the proposed EIP-7251 max effective balance increase or future issuance curve adjustments).
Under the base case scenario, where staking participation stays in the 27-32% range and burn averages roughly 700,000 ETH per year, total supply would grow from 120.5 million in 2026 to approximately 121.2 million by 2030. That works out to a cumulative inflation rate of less than 0.6% over four years, or roughly 0.15% per year. This is a remarkable monetary stability for a programmable smart contract platform.
Under a bullish DeFi scenario, where Layer 2 networks (settling to Ethereum L1) drive sustained high blob and calldata burn, plus a memecoin or NFT cycle adds gas demand, supply could actually shrink to around 119.5 million by 2030. Under a bearish scenario where activity collapses and staking participation grows to 40%+, supply could grow to around 122.3 million. Either way, the range is extraordinarily narrow compared to almost any other digital asset, including Bitcoin's predictable inflation schedule.
Risks and Open Questions in Ethereum's Supply Model
The ultrasound money thesis is elegant, but it is not without challenges. Layer 2 burn dilution is the most important concern. As activity moves to Arbitrum, Optimism, Base, and zkSync, gas burn on Ethereum L1 has shifted from execution fees to blob fees (EIP-4844 introduced cheaper data availability for rollups). Blob fees are also burned, but much cheaper per unit of activity, which has meaningfully reduced the burn rate post-EIP-4844. For comparison with other scaling models, see our sharded blockchain guide.
Restaking via EigenLayer and competitors lets ETH stakers re-pledge their stake to secure additional services. This has driven new demand but raises systemic risk if a major restaking protocol experiences a slashing event (already 2.6M ETH restaked). Issuance curve revisions are also being discussed, with researchers proposing downward adjustments to discourage staking from growing past 50% of supply. Regulatory treatment of staking and liquid staking derivatives continues to evolve across jurisdictions and could push activity into non-custodial alternatives. Our DeFi guide covers more regulatory context.
Best Practices for Tracking ETH Supply as a Trader
If you trade ETH or any ETH-paired asset, supply dynamics should inform your thesis. Here is a checklist of metrics worth keeping on your dashboard.
- Total ETH burned in the last 24h
- Net supply change (burn minus issuance)
- Exchange inflows / outflows
- Staking deposit queue length
- Active validator count
- ETF net flows (BlackRock, Fidelity, etc.)
- Total supply on exchanges
- Liquid staking TVL changes
- DeFi TVL denominated in ETH
- Realized supply (long-term holders)
- Rolling 30-day burn vs issuance ratio
- Validator queue join / exit time
- Top 100 wallets cumulative holdings
- Wrapped ETH (wstETH, rETH) growth
- Active addresses and gas demand trends
If you build a routine around these metrics, you will have a better picture of ETH's supply-side fundamentals than 95% of market commentators. Most analysts treat supply as a static number, but the smart money increasingly trades around supply velocity, not just the headline figure. To stay current on overall market context, our piece on whether to buy ETH right now ties supply dynamics into a broader investment framework, and the guide to selling ETH effectively covers the exit side. For broader risk-management context, the crypto liquidation zones guide is essential reading.
Common Misconceptions About ETH Supply
The crypto space is full of misinformation about Ethereum's supply. The most common attack line is that "Ethereum has infinite supply." Technically true that there is no hard cap, but "infinite" implies uncontrolled issuance, which is the opposite of reality. Net issuance has been close to zero or negative for most of the post-Merge era.
"Staked ETH is gone forever" is also wrong. Withdrawals were enabled by the Shanghai upgrade in April 2023, and any staker can exit through a queue (currently 2-3 weeks). Staked ETH is illiquid in the short term, but it is not destroyed. Similarly, "the Foundation controls ETH supply" misunderstands governance. The Ethereum Foundation has zero ability to mint or burn ETH outside protocol rules. Changes require coordinated upgrades from independent client teams (Geth, Nethermind, Besu, Erigon, Reth) and validator buy-in.
Another myth: "EIP-1559 made ETH guaranteed deflationary." Wrong. EIP-1559 made ETH conditionally deflationary when activity is sufficient. It has been net deflationary roughly 35% of the time since 2022. Finally, "lost ETH inflates supply" is backward. Lost coins (estimated 3-5M ETH) reduce circulating supply because they can never be moved. They are functionally identical to burned ETH.
How Supply Dynamics Affect ETH Price Action
Supply is half of the supply-and-demand equation, and ETH's supply story is one of the strongest fundamental cases in the entire crypto market. When you combine 0.2% annual net issuance, 27.5% of supply locked in staking, ETF inflows absorbing 35-50% of new issuance, and exchange balances at multi-year lows, you have a market structure where modest demand increases can produce outsized price moves.
This is why many analysts argue that ETH has a more bullish supply setup than Bitcoin going into 2026 and beyond. Bitcoin's supply schedule is predictable but rigid. ETH's supply schedule is responsive to network usage, meaning growing demand for blockspace mechanically tightens supply. Both have merit, but they are fundamentally different monetary instruments.
For traders, this means watching supply-side catalysts as carefully as demand-side ones. Major events that can move ETH price include large ETF inflow weeks (especially when sustained), spikes in network burn during memecoin or NFT cycles, validator queue dynamics (a long entry queue signals staking demand), and the launch of new restaking protocols. Tools like the Pyth Network oracle can help feed real-time supply and price data into your strategies.
Wrapped, Staked, and Synthetic ETH Variants
One more layer of complexity in answering "how many ETH are there" is the existence of wrapped and synthetic ETH derivatives. These tokens are not new ETH. They represent claims on the underlying ETH or function as ETH-equivalents in different ecosystems. WETH (about 3.2M ETH wrapped) re-issues ETH as an ERC-20 token for DeFi compatibility. stETH (about 9.2M) is Lido's liquid staking derivative. rETH (around 850K) is Rocket Pool's equivalent. wstETH is a rebase-free wrapped version of stETH used across DeFi. Others include cbETH (Coinbase), ankrETH (Ankr), and frxETH/sfrxETH (Frax).
None of these tokens add to total ETH supply. They are claim tokens on underlying ETH locked in respective smart contracts. But they massively increase the financial utility of staked ETH and have become foundational primitives in DeFi.
Frequently Asked Questions
Q How many ETH are there in 2026?
Q Does Ethereum have a maximum supply?
Q How much ETH has been burned since EIP-1559?
Q How much ETH is staked?
Q Is Ethereum deflationary?
Q How much ETH did the Genesis block create?
Q How much ETH did the Merge reduce issuance by?
Q How much ETH do spot ETFs hold?
Q How much ETH does the Ethereum Foundation hold?
Q How much ETH does Vitalik Buterin own?
Q How does ETH supply compare to Bitcoin?
Q Will Ethereum supply ever decrease significantly?
Q Where can I track ETH supply in real time?
Conclusion: Ethereum's Supply Is a Feature, Not a Bug
So, how many ETH are there? The answer is approximately 120.52 million as of May 2026, but the more interesting answer is that Ethereum's supply is dynamic by design. Rather than relying on a static cap, the network uses a sophisticated combination of validator issuance and transaction fee burn to keep net inflation extremely low, often negative, and always responsive to actual network usage.
This monetary design has played out well in practice. Net annual issuance has averaged around 0.21% since the Merge, lower than Bitcoin's fixed schedule. Roughly 27.5% of supply is locked in staking, ETFs have absorbed another 4.5%, exchange balances are at multi-year lows, and long-term holders dominate the float. The result is a tight, structurally bullish supply backdrop that does not depend on artificial scarcity.
For traders and investors, the practical takeaway is that ETH's supply story warrants the same level of attention as Bitcoin's halving narrative. The variables are different (burn rates, validator queues, ETF flows, restaking dynamics) but the impact on price discovery is just as meaningful. Bookmark the dashboards, track the metrics, and you will have a meaningful edge over participants who only look at headlines.
To put supply analysis into action, combine on-chain data from Etherscan and ultrasound.money with real-time pair-level analytics from DEXTools. Layer in market context from our tutorials on how cryptocurrencies work and DeFi fundamentals for the deepest possible understanding of where Ethereum is going next.
Related Guides
- How Many XRP Are There? Total Supply and Escrow Mechanism
- How Many ETH (Ethereum) Do You Need to Be a Validator?
- Who Owns XRP? Founders, Ripple & Supply Dynamics
- What Is Ethereum Staking? How It Works, Rewards and Risks (2026)
- What Is Ethereum (ETH)? Beginner Guide 2026
- What are Verkle Trees? Ethereum Statelessness Explained