Perpetual Futures: Funding, Mark Price & Liquidations
— By AliceOnChain in Tutorials

Perpetual futures are the backbone of crypto trading volume, yet their core mechanics—funding rates, mark price, and liquidations—are frequently misunderstood. This guide breaks down these concepts using advanced on-chain analysis to help you manage leverage risk effectively.
Perpetual Futures Explained: Funding, Mark Price, and Liquidations
The rise of decentralized finance (DeFi) has democratized access to complex financial instruments, most notably perpetual futures. Often referred to as perpetual swaps, these contracts allow traders to gain leveraged exposure to asset price movements without an expiration date. Unlike traditional futures contracts that settle monthly or quarterly, perpetuals can be held indefinitely, provided the trader maintains sufficient margin.
While this flexibility has made perpetual futures the primary driver of volume across both centralized and decentralized exchanges, it introduces unique mechanical complexities. Trading perpetuals successfully requires a deep understanding of how contract prices align with spot markets, how liquidation thresholds are calculated, and how on-chain data can reveal underlying market risk.
The Mechanics of Price Alignment: Funding Rates Explained
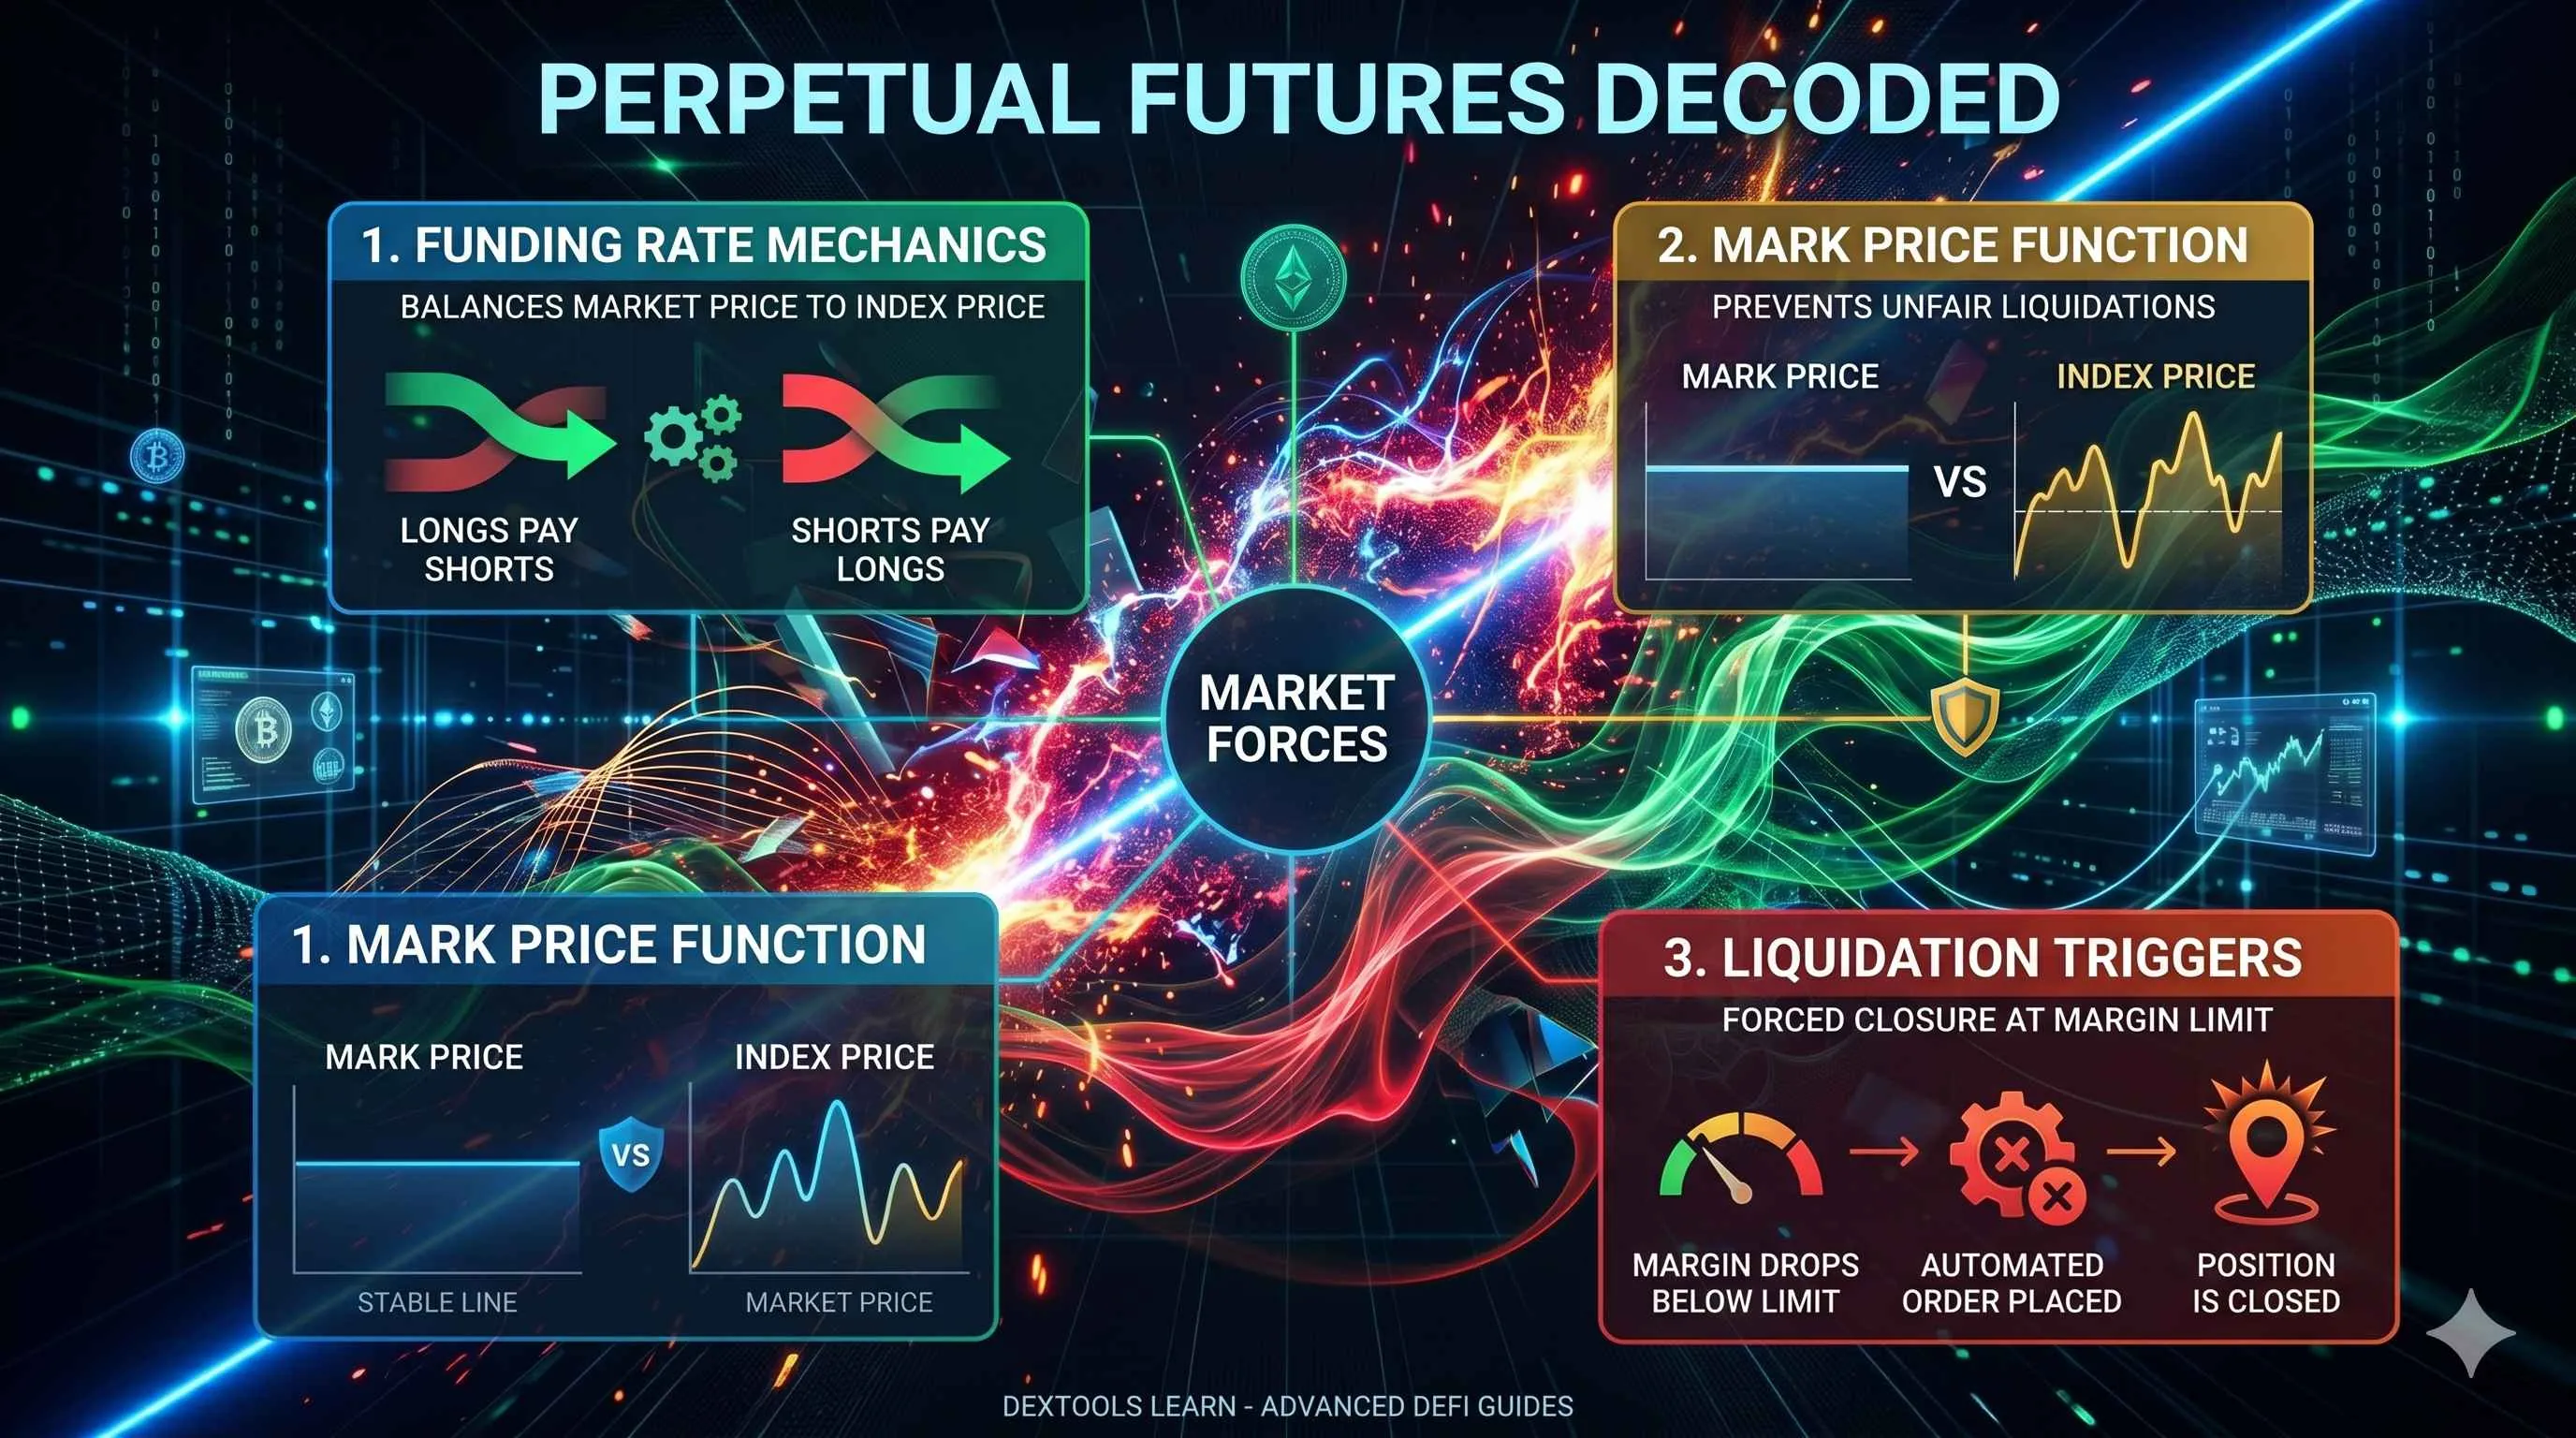
Because perpetual futures do not have an expiration date, they require a synthetic mechanism to ensure the contract price does not permanently diverge from the underlying spot market price. This mechanism is known as the funding rate.
The funding rate consists of periodic payments exchanged directly between long and short traders. When the perpetual contract trades at a premium relative to the spot price, the funding rate turns positive. In this scenario, long position holders pay short position holders. This payment disincentivizes excessive long leverage and encourages arbitrageurs to short the contract, driving the perpetual price back toward the spot price.
Conversely, when the perpetual contract trades at a discount relative to the spot price, the funding rate becomes negative. Short position holders must then pay long position holders, incentivizing buyers to step in.
Evaluating Market Sentiment via Funding
Analyzing the funding rate provides critical insights into market sentiment and leverage positioning.
Prolonged Positive Funding: Highly positive funding rates historically suggest an overcrowded long market. This can indicate that retail traders are aggressively buying on leverage, leaving the market vulnerable to a sudden correction.
Prolonged Negative Funding: Deeply negative funding rates may signal intense bearish sentiment, where shorts are paying a premium to maintain their positions.
Advanced traders frequently monitor these shifts alongside spot market indicators. For instance, using the DEXTools Charts feature allows traders to overlay volume and price action to see if a rising spot price is backed by genuine liquidity or driven purely by leveraged futures speculation. If spot volume stalls while funding rates spike, it often suggests the upward move is fragile.
Index Price vs. Mark Price: Safeguarding Against Manipulation
In perpetual futures trading, an asset is tied to three distinct prices: the market price (order book or automated market maker price), the index price, and the mark price. Understanding the difference between these three is essential for volatility management.
The market price is simply the current price at which the contract is trading on that specific platform. The index price represents the average spot price of the asset across multiple major exchanges, acting as an aggregate benchmark for true market value.
The mark price is a calculated metric that combines the index price with a decaying funding element. The primary purpose of the mark price is to determine unrealized profit and loss (PnL) and to trigger liquidations.
Why Mark Price Matters
By using the mark price rather than the latest market price to trigger liquidations, platforms protect traders from short-term market manipulation or localized liquidity crunches. If a whale executes a massive market order that temporarily crashes the order book price on a single exchange, the index price and mark price will remain relatively stable. Consequently, positions are not prematurely or unfairly liquidated due to artificial volatility.
When trading highly volatile or newly listed on-chain assets, tracking underlying spot liquidity becomes a critical defensive measure. Utilizing DEXTools Liquidity Tracking allows traders to evaluate the depth of the pool supporting the asset's index price. A shallow liquidity pool can lead to wider discrepancies between the spot price and the perpetual contract price, increasing the probability of rapid adjustments in the mark price.
The Reality of Liquidations: Maintenance Margin and Forced Closure
Liquidation is the automated process of forcibly closing a trader's position because their account equity has fallen below the required maintenance margin threshold. In leveraged trading, you borrow capital to amplify your position size. The margin you deposit acts as collateral to absorb potential losses.
As the mark price moves against a leveraged position, unrealized losses subtract directly from the trader's collateral. If the mark price reaches the liquidation price, the position is automatically taken over by the platform's liquidation engine to prevent the trader's balance from slipping into negative equity.
Identifying Liquidation Triggers with Technical Analysis
Predicting where large clusters of liquidation prices reside is a highly effective strategy for anticipating market volatility. Markets tend to seek areas of high liquidity, which often sit just beyond major support and resistance levels.
RSI Divergence and Support Breakdown: When an asset approaches a major support level while displaying a bearish Relative Strength Index (RSI) divergence, it can signal that buying momentum is fading. A breakdown below that support level can trigger a cascade of long liquidations.
Whale Activity and Cascades: Large holders, or whales, often capitalize on these clusters. By tracking whale activity through DEXTools Holder Analysis, traders can observe if concentrated supply is moving toward exchanges or decentralized protocols, which historically precedes a volatile expansion.
If a liquidation cascade begins, forced market orders execute sequentially, driving the price down further and triggering subsequent liquidations. Traders can implement DEXTools Price Alerts to stay informed of sharp, sudden movements that might threaten their liquidation thresholds.
On-Chain Blueprint: Monitoring Futures Risk Factors
To navigate the risks associated with perpetual futures, a structured approach to analyzing on-chain variables is essential. Below is a framework for evaluating market health before deploying leveraged capital.
Step 1: Analyze Holder Distribution and Token Concentrated Risk
Before trading a perpetual contract, examine the asset's spot distribution. Use DEXTools Holder Analysis or visual integration tools like Bubblemaps to ensure a small group of wallets does not control a dominant portion of the circulating supply. High token concentration increases the risk of abrupt spot dumps, which directly shift the mark price and cause cascading liquidations for futures traders.
Step 2: Evaluate Core Liquidity and Depth
Navigate to the Pair Explorer on DEXTools to inspect the total locked liquidity and daily volume metrics. A high volume-to-liquidity ratio can indicate speculative efficiency, but if liquidity is too shallow, even moderate spot selling can cause wild swings in the index price. Ensure the spot market possesses sufficient depth to absorb regular trading activity without causing massive slippage.
Step 3: Monitor Momentum and Volume Divergences
Examine the active chart for structural anomalies. Look for price pushing toward new highs while trading volume trends downward, or monitor the RSI for clear divergences. A rising price on declining volume or weakening momentum suggests that the trend is heavily reliant on leveraged futures buyers rather than organic spot accumulation.
Step 4: Map Support, Resistance, and Estimated Liquidation Zones
Identify key horizontal support levels on the daily and four-hour charts. Assume that significant clusters of retail liquidation prices sit directly below these levels. If the asset begins to retest these zones frequently, the probability of a liquidation hunt increases. Setting up localized alerts ensures you are notified if these defensive structures begin to fail.
Mitigating Risk in Leveraged Environments
Perpetual futures offer remarkable capital efficiency, but they require strict discipline. Managing risk in these environments relies on a few fundamental practices:
Utilize Isolated Margin: Unlike cross margin, which risks your entire account balance, isolated margin limits your maximum potential loss on a single trade to the specific collateral allocated to that position.
Maintain Conservative Leverage: High leverage drastically compresses the distance between your entry price and your liquidation price. Reducing leverage provides your position with the necessary breathing room to withstand normal intra-day volatility.
Formulate an Independent Exit Strategy: Never rely solely on a platform's liquidation engine or a mental stop-loss. Hard stop-loss orders should be set based on structural changes in the spot chart rather than arbitrary financial thresholds.
Conclusion
Perpetual futures are a sophisticated tool for navigating the digital asset markets, but they are fundamentally governed by strict mathematical rules. Funding rates reflect the broader market's structural leverage balance, the mark price shields traders from erratic pool manipulation, and liquidations act as the clearing mechanism when risk management fails.
By pairing a deep understanding of these core principles with comprehensive on-chain tools like DEXTools to monitor liquidity, whale movements, and volume trends, traders can approach the market with a probabilistic mindset, prioritizing capital preservation over speculative exposure.
Fake Volume vs Real Demand: How to Spot Artificial Momentum in DeFi Trading
Isolated vs Cross Margin in Crypto: Which to Use
Is On-Chain Data Replacing Technical Analysis in Crypto?
Disclaimer: This article is for informational purposes only and does not constitute investment advice, financial advice, trading advice, or any other kind of advice. DEXTools does not recommend buying, selling, or holding any cryptocurrency or token. Users should conduct their own research and consult with a qualified financial advisor before making any investment decisions. Cryptocurrency investments are volatile and high-risk. DEXTools is not responsible for any losses incurred.