Reading Defended Price Zones on a DEX
— By Whatsertrade in Tutorials
Learn to identify support zones on DEXs without order books using market reactions, volume, and liquidity insights.
In traditional markets, traders often use order books to identify support and resistance. They look for visible bids, sell walls and resting liquidity. But decentralized exchanges work differently.
On many DEXs, there is no traditional order book showing where buyers and sellers are waiting. Instead, price moves through swaps, liquidity pools and real time market behavior. This means traders need a different way to identify support.
A support zone on a DEX is not always visible before price reaches it. Often, it is revealed by how the market reacts when price enters that area.
What Is a Defended Zone?
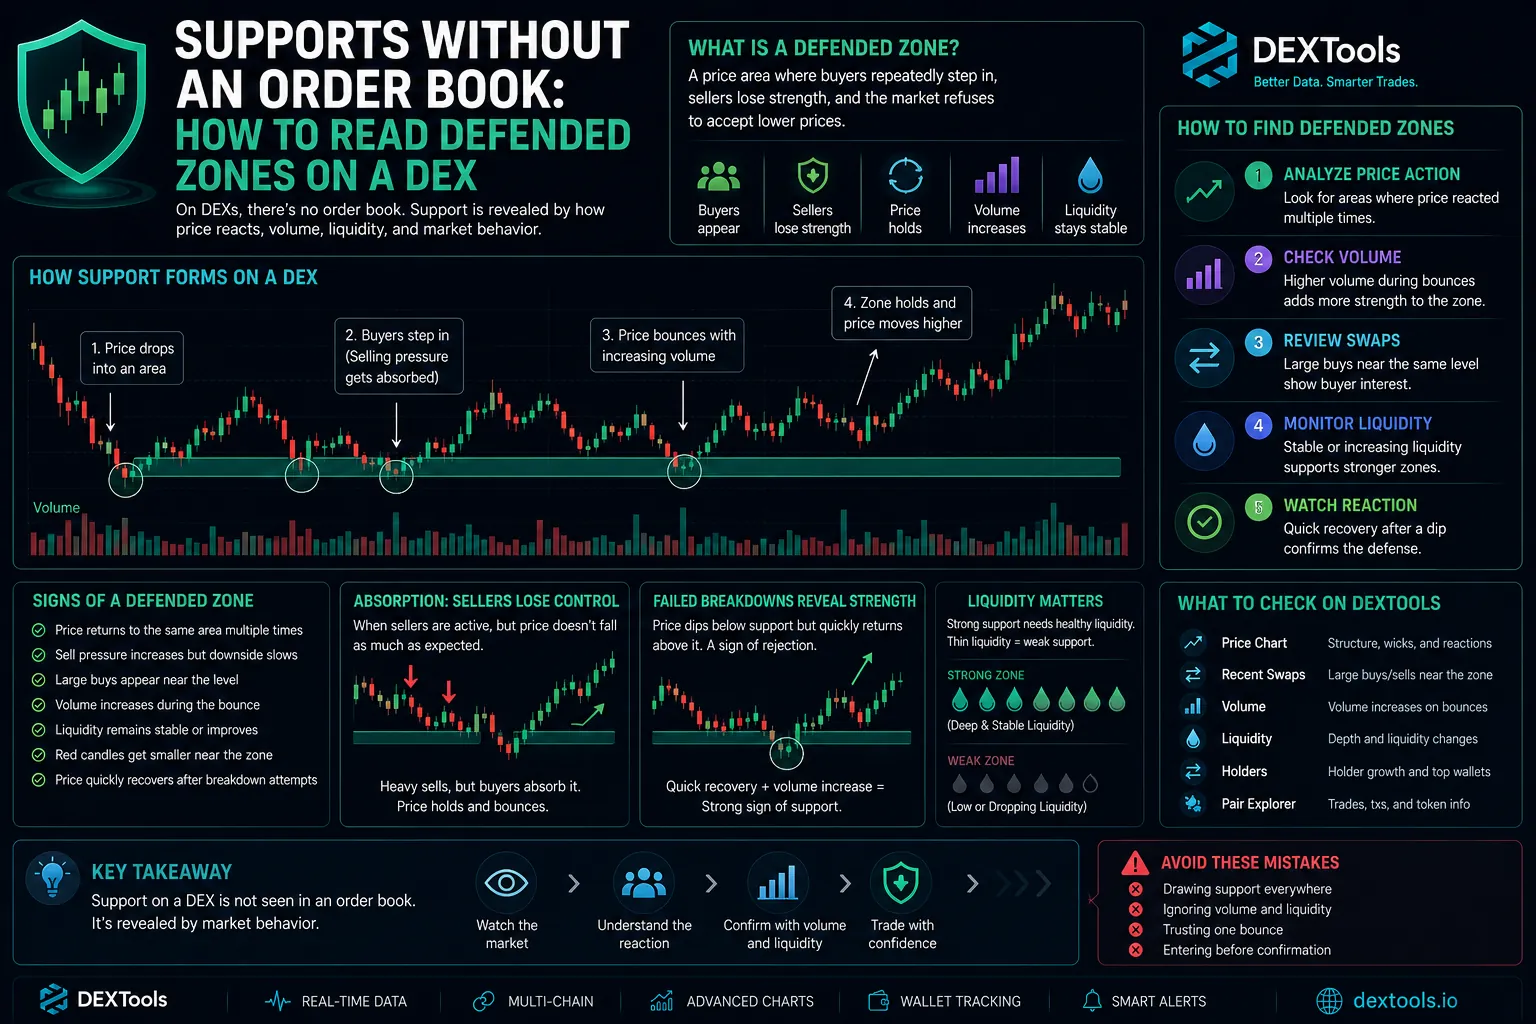
A defended zone is a price area where buyers repeatedly step in, sellers lose strength or the market refuses to accept lower prices.
It is not a magic line. It is a behavioral area.
In DEX trading, a defended zone may appear when large buyers enter near the same level, sell pressure gets absorbed, liquidity remains stable or price recovers quickly after a breakdown attempt.
The key idea is simple: support is not only where price bounced before. Support is where market participants show that they are willing to act.
Why DEX Support Is Different
On a centralized exchange, support can sometimes be seen through visible buy orders. On a DEX, traders usually need to infer support from executed transactions and price reaction.
This makes DEX support more dynamic. Instead of asking “where are the bids?” traders should ask:
Where did buyers actually appear?
Where did sellers fail to push price lower?
Where did price react with strength?
Where did volume increase during a bounce?
The answer is found in behavior, not in a static order book.
Signs of a Defended Zone on a DEX
A potential support zone becomes more meaningful when several signals appear together.
Common signs include:
- Price returns to the same area more than once and bounces
- Sell pressure increases but downside movement slows
- Larger buys appear near the same level
- Volume rises during the recovery
- Liquidity remains stable or improves
- Red candles become smaller near the zone
- Price quickly recovers after a temporary breakdown
One bounce is not enough. The best defended zones show repeated evidence that buyers are active.
Absorption: When Sellers Lose Control
Absorption is one of the most important concepts for reading support on a DEX.
Absorption happens when sellers are active, but price does not fall as much as expected. In other words, the market receives selling pressure but buyers absorb it.
For example, if several large sells hit the chart near a specific level but price holds, that zone may be defended. If price drops briefly and then quickly recovers, buyer demand may be stronger than it first appears.
This is especially useful in low liquidity markets, where price can move sharply. A red candle alone does not always mean weakness. The important question is what happens after the sell.
Failed Breakdowns Can Reveal Strong Support
A failed breakdown happens when price moves below a support area but quickly returns above it.
On a DEX, this can be an important signal. Thin liquidity can create temporary wicks below key levels. Panic sellers may exit, but if buyers step in quickly, the breakdown may fail.
A failed breakdown can show that the market rejected lower prices.
Traders should watch for three things:
- Did price recover quickly?
- Did volume increase during the recovery?
- Did buyers continue after the bounce?
If the answer is yes, the zone may become stronger.
Liquidity Matters Around Support
Support is more reliable when liquidity supports the move.
If price approaches a support zone while liquidity remains stable, traders may have more confidence in the area. If liquidity disappears as price approaches support, the level becomes weaker.
A support zone with poor liquidity can fail quickly. A support zone with healthy liquidity can absorb more selling pressure.
This is why traders should not analyze price alone. A support level is stronger when price reaction, volume and liquidity all point in the same direction.
How to Use DEXTools to Read Defended Zones
DEXTools can help traders study defended zones by combining chart behavior with on chain market data.
Useful areas to review include:
- Price chart structure
- Recent swaps
- Volume changes
- Liquidity trends
- Holder behavior
- Large buys and sells
- Token pair activity
The goal is not to guess where support should be. The goal is to identify where buyers have already shown up.
Avoid Drawing Too Many Support Lines
One common mistake is drawing support everywhere. Not every bounce matters. Not every wick creates a strong level.
A real defended zone should show meaningful reaction. It should change trader behavior.
If price touches an area and nothing important happens, the level may not matter. If price touches an area and buyers repeatedly respond, the zone deserves attention.
The best support zones are not the ones with the most lines. They are the ones with the clearest evidence.
Final Thoughts
DEX support zones require a different way of thinking. Without a traditional order book, traders need to read market behavior through swaps, volume, liquidity and price reaction.
A defended zone is not just a line on a chart. It is an area where buyers have shown interest and sellers have struggled to take control.
In decentralized markets, support is not always visible in advance. It is revealed through action.
The smarter trader does not only draw support. The smarter trader studies whether the market is actually defending it.
How to Bridge Crypto Between Chains: Complete Cross-Chain Tutorial 2026 How to Use 1inch: Complete DEX Aggregator Swap Tutorial (2026) How to Use OKX Web3 Wallet: Multi-Chain DeFi Hub Guide (2026)Beyond the Bid-Ask: Understanding Liquidity's Role in Price Defense
While traditional order books offer explicit visual cues for defended price zones through stacked bids, DEXs demand a more nuanced interpretation of underlying liquidity. On a DEX, a "defended" price isn't just a large pending buy order; it's a zone where the collective actions of liquidity providers (LPs) and arbitrageurs create a resilient floor. This resilience stems from the depth and distribution of capital within the liquidity pool, often expressed through concentrated liquidity ranges in AMM v3 models or the overall size of a v2 pool relative to trade volume.
A true defended zone on a DEX is characterized by more than just a momentary bounce. It's a price level where selling pressure is consistently absorbed without a significant price decay, indicating robust underlying liquidity ready to meet demand. This absorption capacity is a critical indicator of a price floor, as it signifies that there are sufficient assets within the pool to counteract selling without triggering a steep slippage cascade.
Identifying Liquidity-Backed Floors
- Observe sustained periods of low slippage for larger sell orders at a particular price point, indicating deep liquidity.
- Look for instances where price recovers quickly after a dip, suggesting active LPs are rebalancing and providing support.
- Analyze the total value locked (TVL) in a specific liquidity pool relative to its daily trading volume; higher TVL often implies stronger defense.
- Pay attention to the distribution of concentrated liquidity ranges; a dense cluster of liquidity around a price can act as a strong buffer.
- Consider the presence of active arbitrage bots that consistently rebalance pools, reinforcing price stability around fair value.
Related Guides
- What Are Liquidation Zones in Crypto: Complete Heatmap Guide (2026)
- How to Sell Ethereum (ETH): 6 Best Methods (2026)
- XRP to USD: Live Ripple Price Converter & Guide 2026
- WIF to USD: dogwifhat Price Today | Live Converter
- XRP Price Prediction 2030: Honest Bear/Base/Bull Analysis
Frequently Asked Questions
How do I find support zones on a DEX without an order book?
Look for areas where price drops sharply and then quickly reverses, indicating buyers stepped in. High trading volume during these reversals suggests strong interest and potential support. Analyze liquidity pools for significant shifts or concentrations around these price levels.
What is a defended price zone?
A defended price zone is a price range where market participants, often large holders or automated bots, actively buy to prevent the price from falling further. This creates a floor, as demand increases whenever the price approaches this level, signaling a strong support area.
How does trading volume help identify support?
High trading volume when price is falling but then quickly reverses indicates that many buyers are stepping in at that specific price. This strong buying pressure suggests that the price level is considered a good entry point and is likely to act as a support zone, preventing further declines.
Can liquidity pool data help identify defended zones?
Yes, significant concentrations of liquidity around a specific price range can indicate a defended zone. Large liquidity providers might be incentivized to maintain price stability around these points, or smart contracts may be programmed to add liquidity at certain thresholds, effectively creating a price floor.