Top DAOs by Treasury and Activity in 2026: On-Chain Guide
— By AliceOnChain in Tutorials

Decentralized Autonomous Organizations (DAOs) manage billions in digital assets, but balance sheet size alone does not dictate longevity. This advanced guide breaks down the top DAOs in 2026 by treasury composition and on-chain activity, providing a step-by-step framework to evaluate protocol health and spot structural changes before they manifest in price action.
Top DAOs by Treasury and Activity in 2026: An Advanced On-Chain Analysis Tutorial
The decentralized finance (DeFi) landscape in 2026 relies heavily on Decentralized Autonomous Organizations (DAOs) to govern core monetary protocols, scaling networks, and liquid staking systems. While early crypto governance often focused strictly on nominal market capitalization, modern market conditions demand a more rigorous framework. Evaluating the top daos 2026 requires looking beyond surface-level metrics to analyze actual treasury diversification, sustainable revenue, and authentic on-chain velocity.
For retail traders and advanced DeFi participants, a DAO’s treasury size represents structural backing, but its operational activity dictates market relevance. When protocol engagement drops while token supply dilutes, structural inefficiencies often arise. Conversely, intense on-chain activity coupled with a highly liquid balance sheet can signal long-term network resilience. This tutorial provides a systematic approach to identifying the structural leaders of the current market cycle and analyzing their underlying technical health.
The Landscape of Top DAOs in 2026: Treasury vs. Real Engagement
The largest DAOs by balance sheet depth span across decentralized stablecoin protocols, automated market makers (AMMs), Layer-2 scaling layers, and decentralized physical infrastructure networks (DePIN). Entities such as Arbitrum DAO, Optimism, Uniswap DAO, Mantle, and Sky (formerly MakerDAO) command significant native and non-native digital assets.
However, evaluating a DAO purely by the fiat value of its treasury can introduce analytical errors. A significant percentage of many DAO treasuries consists of their own unallocated native governance tokens. If a protocol holds billions of dollars in its own token, but market liquidity for that token is thin, the effective purchasing power of the treasury is significantly lower than its nominal valuation.
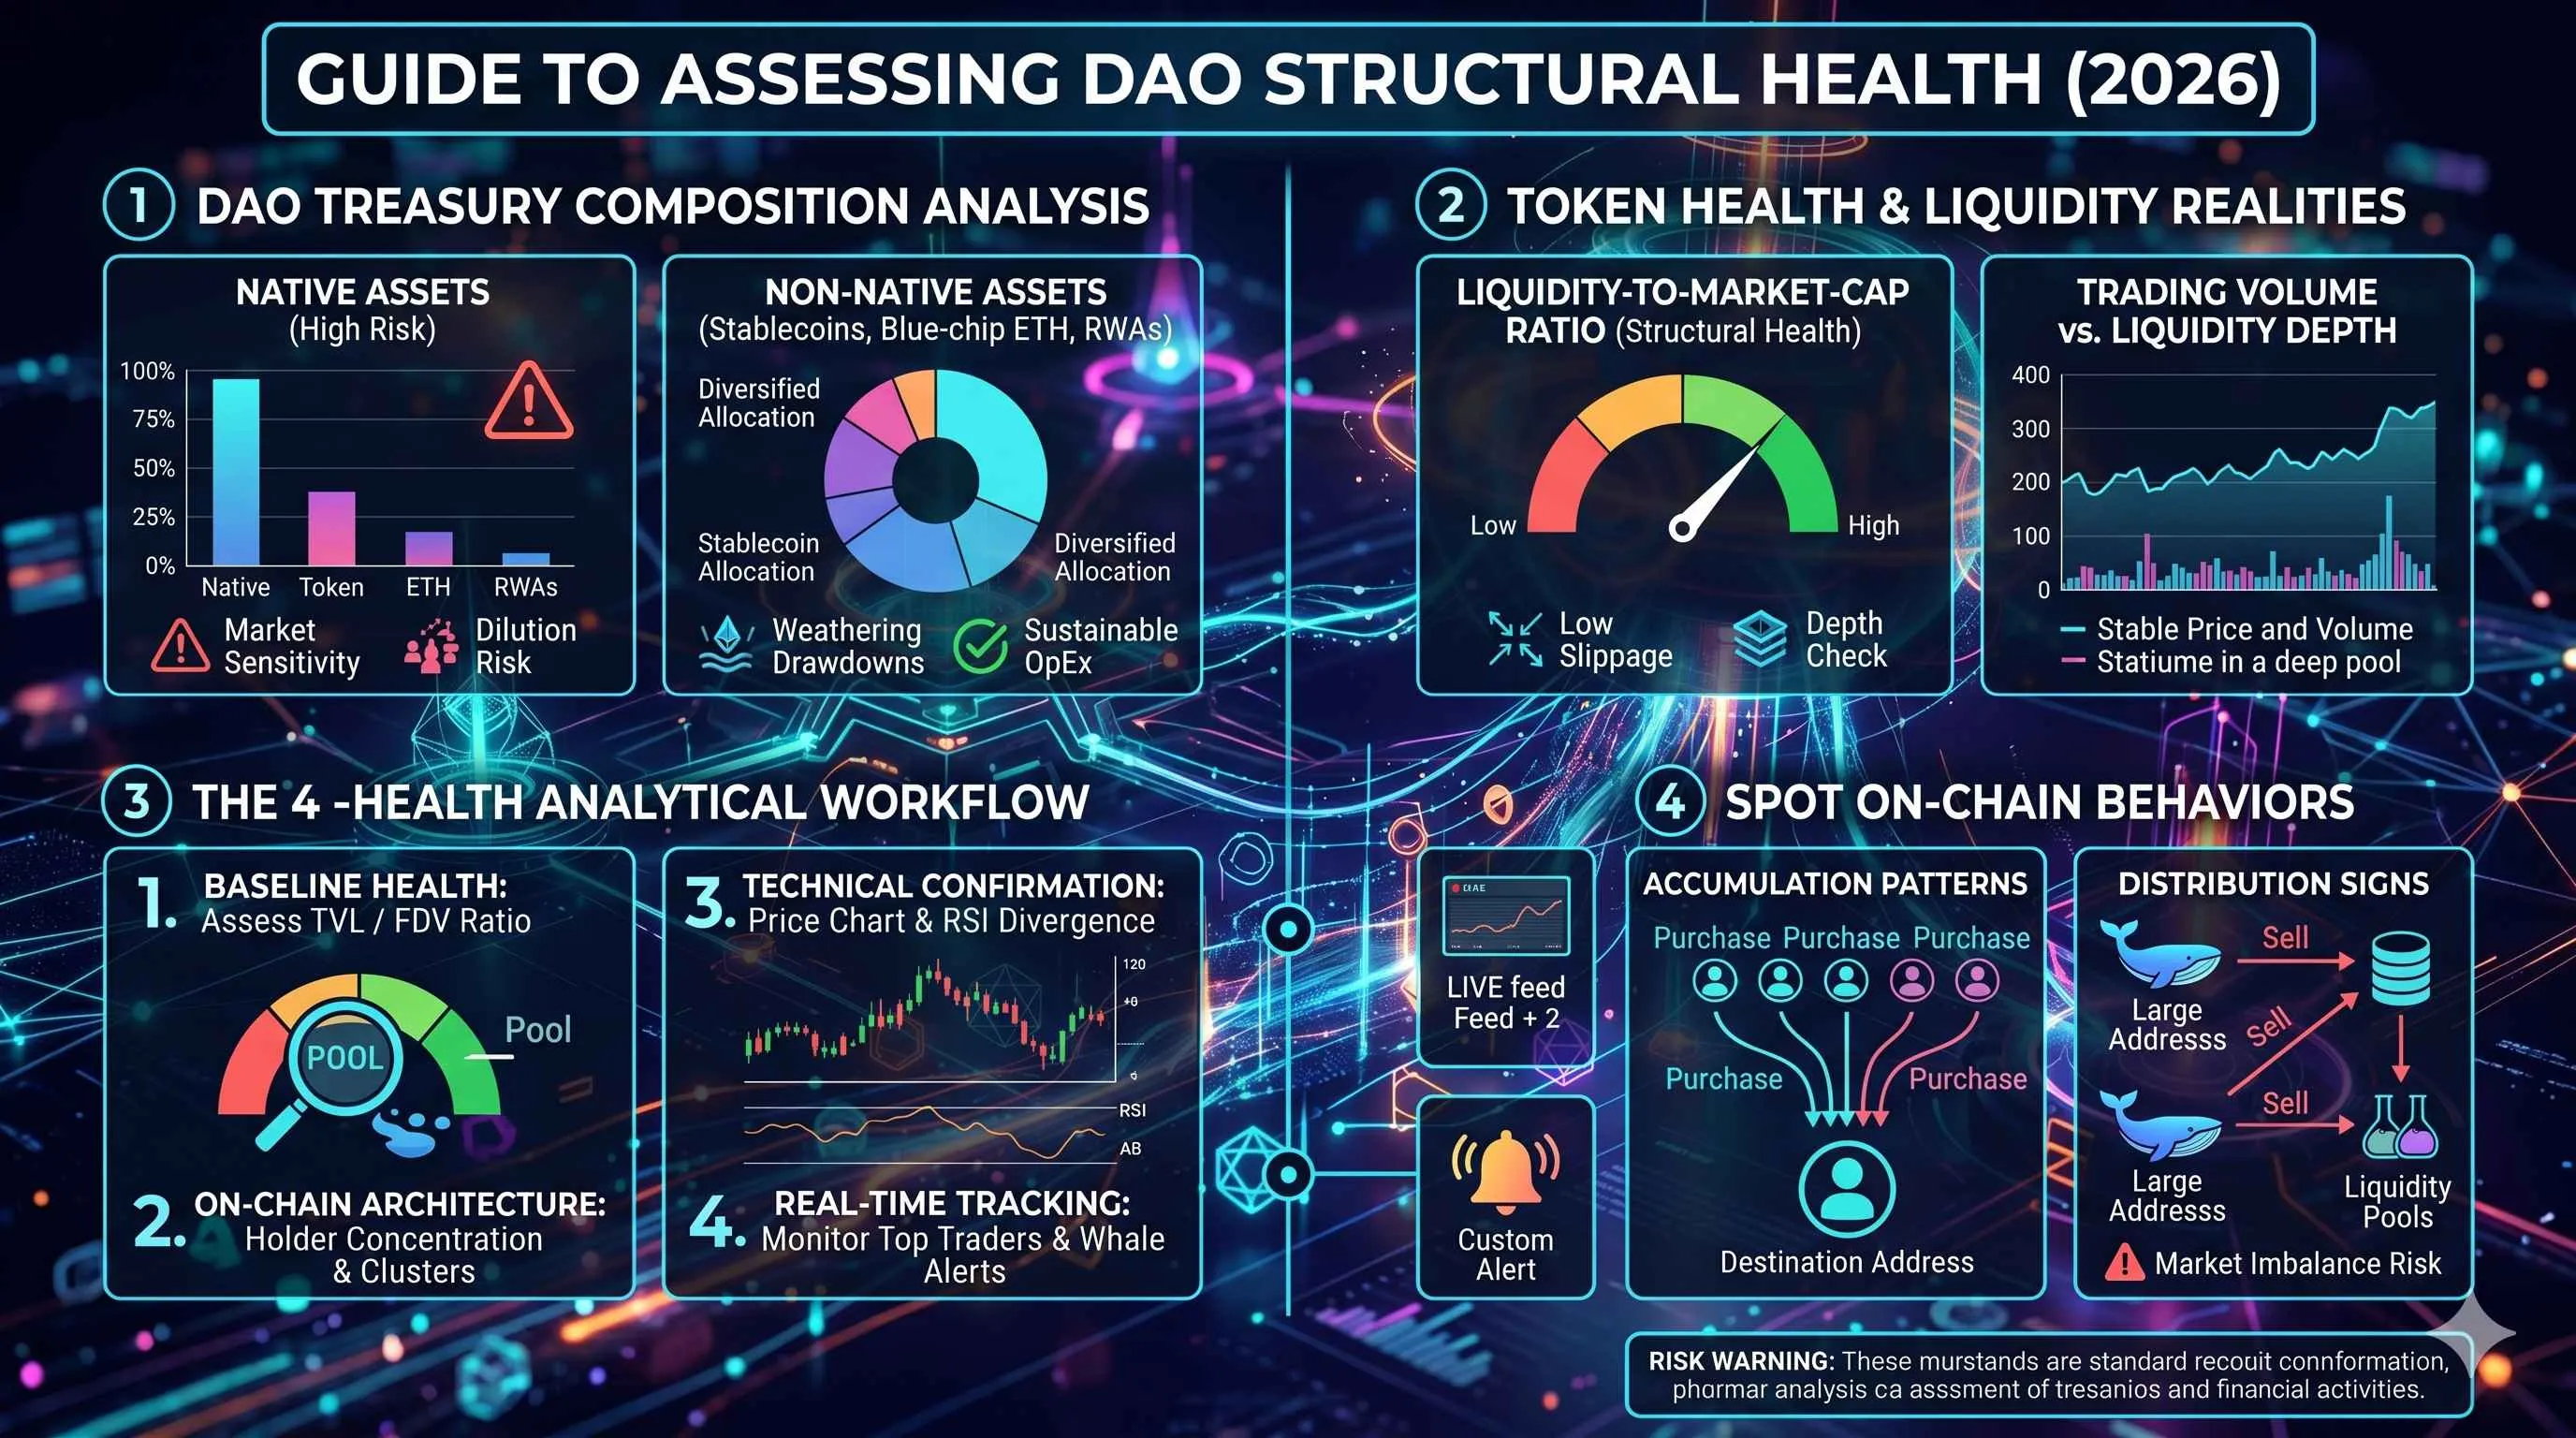
For a realistic assessment, advanced analysts divide treasury assets into two core buckets:
Native Assets: The protocol's own issued governance token, which is highly sensitive to market volatility and localized sentiment.
Non-Native Assets: Stablecoins (USDC, USDT, USDS), blue-chip crypto assets (ETH, BTC), and tokenized Real-World Assets (RWAs) such as short-term US Treasuries.
A healthy DAO treasury typically shows increasing diversification into non-native, yield-bearing, or stable assets. This diversification allows the protocol to sustain development grants, security audits, and operational expenditures during prolonged market drawdowns without exerting compounding sell pressure on its native token.
Core Metrics for Evaluating DAO Token Health
To determine whether a dominant DAO is retaining structural strength or showing signs of distribution, you must blend technical chart factors with raw on-chain tracking data.
Volume and Liquidity Realities
Price appreciation accompanied by declining trading volume often indicates an exhausting trend, whereas high trading volume on key support levels can imply heavy accumulation. On-Chain liquidity depth is arguably more critical than daily trading volume.
When analyzing a governance pair in the DEXTools Pair Explorer, look closely at the locked liquidity metric rather than just the circulating market cap. A high market cap token with sparse decentralized pool depth is highly vulnerable to systemic price slippage when large holders or the DAO treasury itself adjusts positions.
Evaluating Holder Distribution via Advanced Visuals
The concentration of supply among top addresses dictates a token's structural vulnerability. A highly centralized asset risks sudden market imbalances if a single entity chooses to liquidate.
Using features like DEXTools Holder Analysis alongside advanced visual tools like Bubblemaps allows you to inspect wallet clusters. This process helps you verify whether seemingly independent addresses are bound by historical, automated transfers, which often indicates concealed whale concentration.
Step-by-Step Tutorial: Analyzing a DAO's Structural Health
To build a repeatable analytical workflow, follow this structured methodology when assessing any top-tier DAO token.
Locate the asset on the DEXTools Pair Explorer. Identify the Total Value Locked (TVL) inside its primary decentralized trading pools and compare it to the fully diluted valuation (FDV). If the pool liquidity represents less than 1% of the circulating float, the asset carries structural slippage risks, regardless of treasury size.
Navigate to the Holder Analysis module. Review the percentage of circulating supply held by the top 10 and top 50 wallets, ensuring you exclude known, documented protocol vesting contracts or bridge addresses. Use the integrated visual bubble mapping features to identify if prominent wallets are interconnected via internal smart contract routing.
Analyze the daily price chart. Plot standard support and resistance zones, then apply the Relative Strength Index (RSI). Search specifically for structural RSI divergences: if the token's price prints a new lower low while the RSI prints a higher low, it can signal an exhaustion of selling momentum near an established support zone.
Examine the live transaction ledger on the Pair Explorer to filter out micro-transactions. Focus exclusively on institutional-sized orders or what the platform flags as Top Traders. Set up specialized DEXTools Price Alerts near key monthly resistance and support parameters to catch real-time breakouts or breakdowns immediately as block validation occurs.
Reading Market Sentiment and Whale Activity
Large-scale holders, commonly referred to as whales, often move capital ahead of broader retail trends. Sudden shifts in whale wallets often precede significant volatility expansions.
Spotting Accumulation Patterns
Whale accumulation is rarely characterized by market orders that spike the price instantly. Instead, large entities historically utilize algorithmic accumulation, breaking their capital into small, uniform orders over days or weeks near deep horizontal support levels.
You can identify this behavior in the live transaction feed by observing repetitive, medium-to-large purchases originating from different decentralized routing paths but settling into identical destination smart contracts or multi-signature setups.
Identifying Distribution Signs
Conversely, institutional or insider distribution often manifests during periods of intense social media hype or positive protocol updates. If a DAO token experiences a sharp price rally on positive governance news, but the on-chain data shows the top 20 non-exchange wallets are systematically offloading portions of their balance into the automated market maker pools, the rally may lack structural longevity. This phenomenon often coincides with a bearish RSI divergence on higher timeframes, showing that while the price is pushed higher by retail market orders, the underlying buying momentum is steadily decaying.
Conclusion and Risk Management Framework
Analyzing the top daos 2026 requires balancing traditional fundamental analysis with rigorous on-chain mechanics. A massive treasury balance sheet can provide a protocol with years of runway, but if the token distribution is heavily centralized, the liquidity pools thin, and the daily transaction velocity dying, the nominal valuation can be highly misleading.
Advanced traders mitigate these structural risks by employing a comprehensive verification strategy:
Always verify that pool liquidity can absorb standard market adjustments without triggering cascading price liquidations.
Utilize momentum oscillators to confirm on-chain whale trends before opening or closing structural positions.
Keep position sizing strictly scaled to the actual pool depth rather than the total market capitalization of the asset.
Ultimately, long-term success in analyzing decentralized structures stems from identifying discrepancies between price action and true on-chain ledger health. By integrating these practices into your daily research workflow, you can successfully navigate the complexities of governance-backed ecosystems while keeping capital preservation at the forefront.
DAO: Decentralized Autonomous Organizations ExplainedRealized Cap vs Market Cap: Advanced On-Chain Guide
Top 5 Liquid Staking Protocols 2026 (Best LSTs Compared)
What Is DePIN: Complete Decentralized Physical Infrastructure Networks Guide (2026)
Disclaimer: This article is for informational purposes only and does not constitute investment advice, financial advice, trading advice, or any other kind of advice. DEXTools does not recommend buying, selling, or holding any cryptocurrency or token. Users should conduct their own research and consult with a qualified financial advisor before making any investment decisions. Cryptocurrency investments are volatile and high-risk. DEXTools is not responsible for any losses incurred.