Volatility Smile: Navigating Market Expectations in Crypto
In professional options trading, implied volatility isn't constant. We break down the Volatility Smile, skew dynamics, and the term structure of market expectations.
Reading Market Fear Across Strike Prices
- In the idealized world of financial modeling, the Black-Scholes formula suggests that all options on the same underlying asset with the same expiration should have the same implied volatility. In the real-world Volatility Smile, this couldn't be further from the truth.
- Professional traders know that implied volatility (IV) varies significantly across different strike prices, creating a curvature that reveals the market's collective fears and expectations. Mastering this concept is critical for anyone looking to transition from basic directional trading to sophisticated options strategy.
The Anatomy of the Curve: Smile vs. Smirk
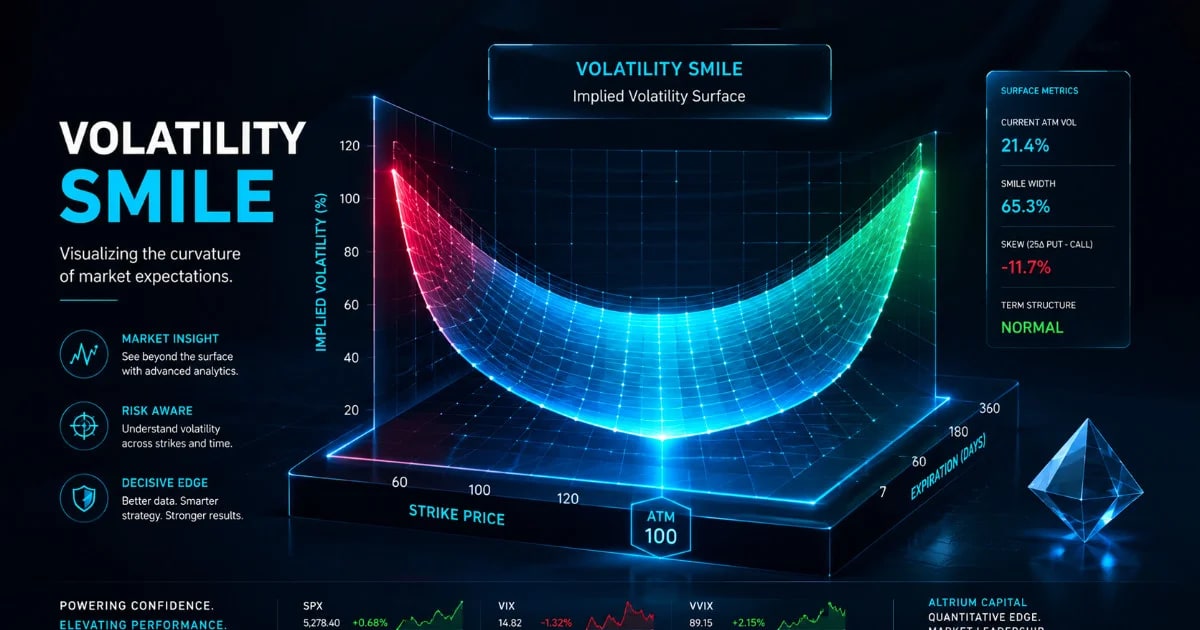
The Volatility Smile is a graphical representation of the relationship between an option's strike price and its implied volatility.
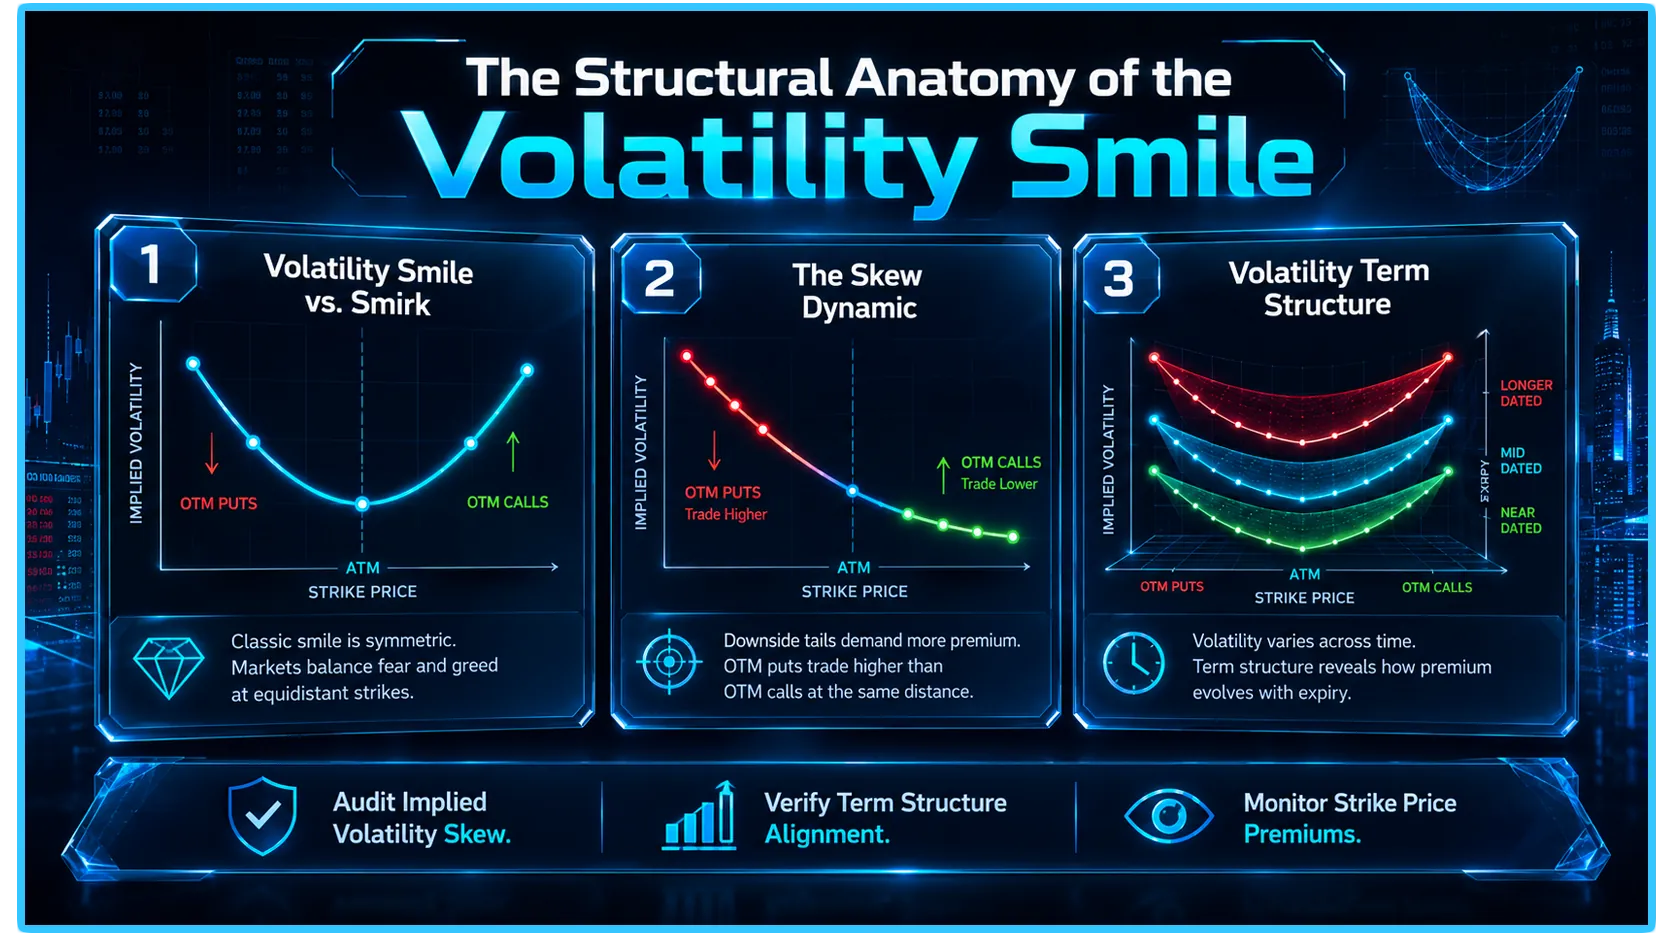
The Smile: Historically observed in equity markets, the "smile" refers to the curve where IV is higher for both deep out-of-the-money (OTM) calls and deep OTM puts. This reflects the market's expectation that extreme price moves—in either direction—are more likely than a standard normal distribution would suggest.
The Smirk: In cryptocurrency markets, we rarely see a perfect "smile." Instead, we see a "skew" or "smirk." Because the crypto market is structurally prone to sudden, violent downward liquidations, investors are willing to pay a massive premium for OTM put options to hedge against "black swan" events. This creates a lopsided curve where the IV for low-strike puts is significantly higher than the IV for high-strike calls.
Understanding Skew and Term Structure
The Volatility Smile is not a static line; it shifts based on two primary factors: the spatial distribution of strikes (skew) and the temporal distribution of expirations (term structure).
The Skew Dynamic
The "skew" measures the difference in implied volatility between OTM puts and OTM calls. A steep skew indicates high demand for downside protection. If you are selling volatility, you are essentially "collecting" this skew premium. However, you must be compensated for the risk that the market makes a catastrophic move, which is exactly why the skew exists—it is the market’s pricing of "tail risk."
The Term Structure
- While the smile looks at strikes at a single point in time, the "term structure" looks at how volatility expectations change across different expiration dates. If near-term options have higher IV than long-term options, the market is expecting imminent volatility (a "backwardated" term structure).
- Conversely, if long-term options are more expensive, the market expects a slow, creeping build-up of volatility (a "contango" term structure). Analyzing the term structure allows traders to choose the most efficient duration for their volatility-based strategies.
Applying the Smile to Strategy
- Why does the Volatility Smile matter to you? Because it identifies the "richness" or "cheapness" of an option. If you believe the market is overestimating the probability of a crash, you might sell the expensive OTM puts (selling the skew). If you believe the market is underestimating the potential for a massive upside move, you might buy the relatively cheap OTM calls.
- Trading options without understanding the smile is akin to trading commodities without looking at supply and demand. The smile is, in essence, the market's supply-demand curve for protection.
Telemetry and Verification
- Even when utilizing advanced options strategies, you must anchor your view in the underlying liquidity reality. DEXTools provides the data telemetry needed to verify if the IV skew is being driven by genuine market positioning or by temporary order book imbalances.
- By using the Pair Explorer and tracking the depth of liquidity pools, you can confirm whether the "fear" reflected in the volatility skew is backed by on-chain volume. DEXTools allows you to verify if the market's demand for downside protection is manifesting in spot market sell pressure, ensuring your hedging strategy is aligned with real-time on-chain data.
You can access DEXTools here and start trading today!
Disclaimer: This article is for informational purposes only and does not constitute investment advice, financial advice, trading advice, or any other kind of advice. DEXTools does not recommend buying, selling, or holding any cryptocurrency or token. Users should conduct their own research and consult with a qualified financial advisor before making any investment decisions. Cryptocurrency investments are volatile and high-risk. DEXTools is not responsible for any losses incurred.