The Liquidity Decay Curve: How Token Markets Lose Depth Before They Lose Price
— By Whatsertrade in Tutorials

Explore the concept of liquidity decay in DeFi and learn how token markets can weaken before visible price changes occur.
A token can start weakening before the price chart admits it.
In DeFi trading, many traders wait for price to break down before they recognize danger. But on decentralized exchanges, liquidity often tells the story earlier. A pool can begin to lose depth, stability, and resilience while the chart still looks normal.
This gradual weakening is the liquidity decay curve.
The liquidity decay curve describes how a token market loses strength beneath the surface before price fully reacts. Traders who understand this concept can spot early warning signs before the chart becomes obvious.
What Is the Liquidity Decay Curve?
The liquidity decay curve is the process by which a token slowly loses pool depth, trading quality, and market support.
At first, the chart may still look healthy. Price might move sideways or even continue rising. But behind the chart, liquidity may be shrinking. Large swaps may create more price impact. Exits may become less efficient. The market may become easier to move with smaller trades.
This is not always dramatic. Sometimes liquidity decay happens quietly. That is what makes it dangerous.
Why Liquidity Can Weaken Before Price
Price is the most visible part of the market, but liquidity is the foundation.
A token can maintain price for a while even as liquidity declines. This can happen when selling pressure is low, when traders are distracted by bullish narratives, or when small buys keep the chart alive.
But weak liquidity reduces the market's ability to absorb stress. When pressure finally arrives, the chart can move violently because the pool no longer has enough depth.
In this sense, liquidity decay is like structural damage. The building may still stand, but the foundation is weaker.
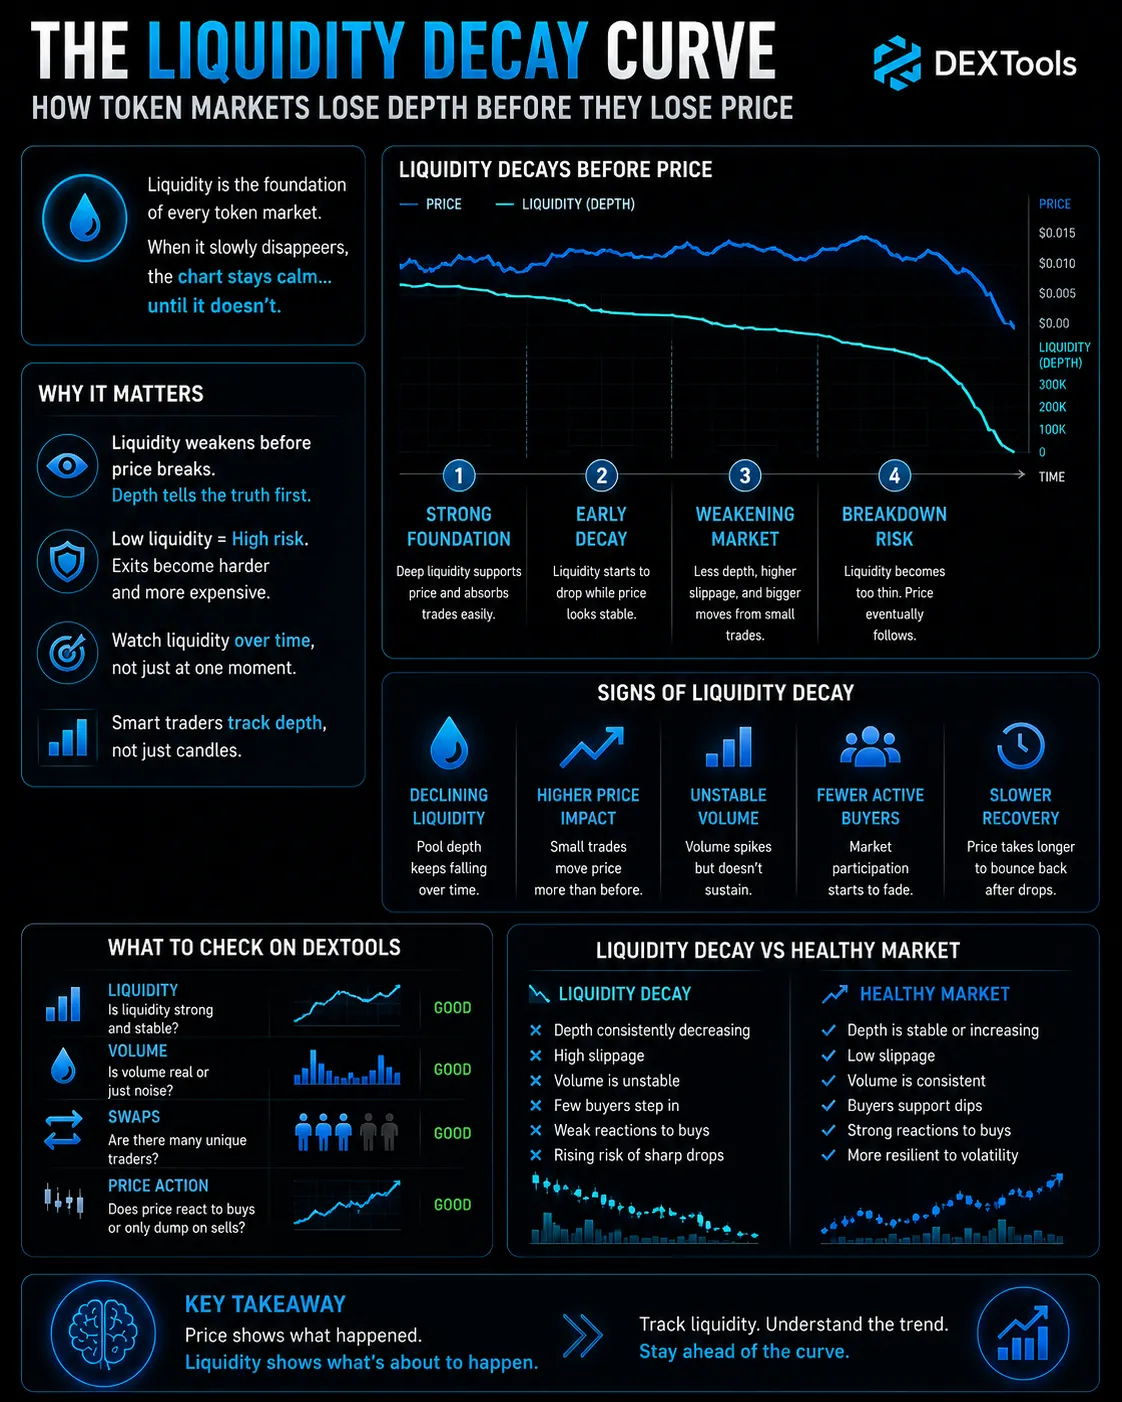
Signs of Liquidity Decay
One sign is a steady drop in pool depth while price remains flat. This means the market may be losing protection even though the chart has not yet collapsed.
Another sign is rising price impact. If similar trade sizes begin moving the price more than before, liquidity quality may be declining.
A third signal is unstable volume. If volume spikes briefly but fails to create stronger liquidity or better market structure, the market may be relying on attention rather than depth.
Traders can use DEXTools to monitor liquidity, volume, swaps, pair activity, and chart behavior together.
Why Price Alone Is Late
Price often reacts after liquidity has already weakened.
By the time a chart breaks down, the best warning signs may have already appeared in the pool. Traders who only watch candles may enter just as the market becomes harder to exit.
This is why liquidity analysis matters. It helps traders understand not only where price is, but how strong the market is underneath that price.
A token with strong liquidity can survive pressure better. A token with decaying liquidity may collapse faster than expected.
How Liquidity Decay Affects Traders
Liquidity decay increases risk in several ways.
First, it can make exits more expensive. Second, it can increase volatility. Third, it can create misleading candles because smaller trades start moving price more dramatically. Fourth, it can attract opportunistic traders who understand that the market is fragile.
For retail traders, the danger is entering a token that looks stable but has already lost its support system.
How to Use the Liquidity Decay Curve
Traders should watch how liquidity changes over time, not only at one moment.
Is liquidity growing with volume? Is pool depth stable during sell pressure? Are large swaps absorbed well? Does the market recover after volatility?
If the answer is no, the token may be moving along the liquidity decay curve.
The goal is not to avoid every token with changing liquidity. The goal is to understand whether liquidity is improving, stable, or slowly weakening.
Final Thoughts
The liquidity decay curve teaches traders to look below the surface.
A token does not always lose price before it loses strength. Sometimes it loses liquidity first. Then it loses stability. Then it loses buyer confidence. Finally, price follows.
Smart DEX traders do not wait for the chart to scream danger.
They listen when liquidity starts whispering it.
Pool Chart Divergence: When the Candle Looks Bullish but the Liquidity Says No Liquidity Velocity: Why Fast LP Changes Matter More Than Total Liquidity Exit Liquidity Mapping: Who Might Sell Into You Before You Buy? Apparent Liquidity vs Executable Liquidity: Why a Large Pool Can Still Give You a Bad EntryFrequently Asked Questions
What is liquidity in crypto?
Liquidity refers to how easily a cryptocurrency can be converted into cash or other cryptocurrencies without significantly impacting its price. High liquidity means there are many buyers and sellers, allowing for quick trades.
Why is liquidity important for crypto markets?
Good liquidity ensures stable prices and efficient trading. It allows investors to enter and exit positions easily, reducing the risk of large price swings during transactions.
What causes a 'liquidity decay curve'?
A liquidity decay curve describes a phenomenon where a token's market depth gradually diminishes over time, often before its price significantly drops. This can be due to reduced trading interest, concentrated ownership, or dwindling market maker support.
How does low liquidity affect crypto prices?
Low liquidity can lead to increased price volatility. Even small trades can cause significant price movements, making it harder to buy or sell at a desired price.
What are some signs of declining liquidity in a crypto asset?
Signs include widening bid-ask spreads, lower trading volumes, and a decrease in the number of active market participants. These indicate a thinner order book and less robust market depth.