What Is Anchored VWAP in Crypto? Full Trader Guide 2026
— By Tony Rabbit in Tutorials

What is anchored VWAP in crypto? Learn Brian Shannon's method, anchor selection, TradingView setup and real BTC, ETH and SOL case studies.
Anchored VWAP (AVWAP) is the volume-weighted average price calculated from a specific user-chosen anchor point such as an all-time high, a breakout candle, a token launch, or a major news event, instead of resetting at the start of every trading session. It answers a far more useful question than standard VWAP for swing and position traders: where has the average market participant been positioned since the moment that actually mattered?
That single change, choosing the anchor yourself, is what transforms VWAP from a session-bound intraday tool into one of the most flexible context indicators in all of technical analysis. It is the indicator that Brian Shannon built an entire methodology around in his book Maximum Trading Gains with Anchored VWAP, and it is the indicator that has quietly migrated from equity trading desks into the toolkits of serious crypto traders charting Bitcoin, Ethereum, Solana, and the long tail of altcoins on TradingView.
This guide is built for traders who want more than a surface-level definition. We will cover what AVWAP actually is, where it came from, exactly how the math works, how to place anchors that produce real edge, how to plot AVWAP step by step on TradingView, how the indicator behaves differently in 24/7 crypto markets compared to traditional equities, how to stack multiple AVWAPs into a confluence framework, and where it fits alongside complementary tools like standard VWAP, moving averages, and Bollinger Bands. By the end you will have a working framework you can apply to a chart today.
Quick take: Anchored VWAP in 30 seconds
- Definition: AVWAP is volume-weighted average price calculated from a user-chosen anchor bar, not a session reset.
- Popularized by: Brian Shannon, who built a full methodology around AVWAP for equity and crypto trading.
- Best anchors: all-time highs, all-time lows, breakout candles, news event candles, token genesis, ETF launch dates.
- Primary use: dynamic support and resistance, trend control identification, mean-reversion entries.
- Crypto edge: 24/7 markets and event-driven catalysts (listings, halvings, ETF approvals) make AVWAP especially powerful.
What Is Anchored VWAP? A Precise Definition
Anchored VWAP is a volume-weighted average price line that starts calculating from a single user-selected bar on the chart and updates continuously bar by bar from that point forward. The math is identical to standard VWAP, but the start of the calculation window is no longer tied to the session open. You pick the start. The indicator does the rest.
The formula is the same one used by institutional execution algorithms for decades. For each bar after the anchor, you take the typical price (the average of high, low, and close), multiply it by the volume traded on that bar, sum those values cumulatively, and divide by the cumulative volume traded since the anchor. The result is a continuously updating reference that tells you the true average price weighted by participation, not by time.
Why does this matter? Because in any market, especially in crypto, volume is the proxy for conviction. A bar with low volume tells you little about where real money was positioned. A bar with massive volume tells you a great deal. AVWAP gives every bar exactly the weight it deserves based on how much capital changed hands. That is fundamentally different from a simple moving average, which treats every bar equally regardless of whether the market was sleeping or violently repositioning.
A Brief History: From Institutional Desks to Brian Shannon to Crypto
Standard VWAP was originally developed in the 1980s as a benchmark for institutional execution. Pension funds and other large buyers needed a way to measure whether they were filling orders above or below the day's average traded price, and VWAP became the industry yardstick. The indicator stayed largely inside execution desks until Paul Levine, a quantitative analyst, began exploring the idea of starting VWAP calculations from custom anchor points rather than the session open.
The breakthrough for retail adoption came when Brian Shannon, founder of AlphaTrends and a long-time technical analyst, formalized the methodology in his 2023 book Maximum Trading Gains with Anchored VWAP. Shannon turned AVWAP into a complete framework rather than just another indicator. He defined which anchors mattered, how to read the line in context, when to combine multiple AVWAPs, and how to use the indicator across timeframes from intraday to weekly charts. His work moved AVWAP from a niche tool to a mainstream technique used by tens of thousands of traders.
Crypto traders adopted AVWAP later than equities traders, but the migration accelerated rapidly through 2024 and 2025. The reason is simple. Crypto markets are stuffed with discrete events that make excellent anchor candidates: the 2021 all-time highs, the FTX collapse of November 2022, the spot Bitcoin ETF approvals in January 2024, halving dates, major token launches, and listing announcements on Binance and Coinbase. Each is exactly the kind of inflection point AVWAP was designed to measure.
How Anchored VWAP Works Under the Hood
Understanding the mechanics matters because it shapes how you read the line. When you drop an anchor on a specific bar, the indicator captures the high, low, close, and volume from that bar onward. It computes the typical price for each subsequent bar as (high + low + close) / 3, multiplies that by the bar's volume, and adds it to a running cumulative sum. The AVWAP plotted on the current bar equals cumulative(typical_price * volume) / cumulative(volume). AVWAP never repaints once a bar closes. Historical values are fixed.
This produces a few critical behaviors. First, the line is most volatile immediately after the anchor and stabilizes as more bars accumulate. Drop an anchor today and the AVWAP line will hug the recent price action closely. Drop an anchor six months ago and the line will be slow and steady, dominated by the accumulated weight of half a year of trading volume. Second, because volume drives the weighting, single high-volume bars (capitulation candles, breakout candles, news spikes) pull the line strongly toward themselves. That is a feature, not a bug.
Third, AVWAP makes no assumptions about volatility, trend, or distribution. It is a pure descriptive statistic of where capital has been positioned since the anchor. Any predictive value comes from how price reacts to that average, not from the average itself.
VWAP vs Anchored VWAP: The Core Distinction
The fastest way to internalize AVWAP is to compare it directly with the standard session VWAP that most intraday traders already know. They share the same math but solve fundamentally different problems.
For crypto specifically, the AVWAP advantage is larger than it is in equities. Stock markets have a real opening and closing bell, so session VWAP describes a meaningful window of activity. Crypto has no such structure. The exchange "day" is an arbitrary slice of continuous global trading. AVWAP fills the gap by letting you define the window that actually matters to your trade thesis.
Brian Shannon's AVWAP Methodology
Brian Shannon's framework rests on a simple insight: significant price action creates psychological reference points, and the volume-weighted average price from those references describes where buyers and sellers actually live. His methodology can be summarized in four pillars.
Pillar one: trend identification. If price is trading above an AVWAP from a meaningful low, buyers are in control of the move since that low. If price is trading below an AVWAP from a meaningful high, sellers are in control of the move since that high. The line itself is the trend arbiter, not your subjective opinion about whether the chart "looks bullish".
Pillar two: anchor selection discipline. Shannon argues that the quality of an AVWAP signal is entirely a function of the quality of the anchor. Random anchors produce random results. The valid anchors are events the entire market remembers: prior all-time highs, prior all-time lows, earnings releases (or in crypto, ETF approvals and halvings), breakouts from multi-week consolidations, and news catalysts that shifted sentiment.
Pillar three: multiple AVWAPs stacked. A single AVWAP gives you one reference. Three or four AVWAPs anchored to different significant events give you a map. Shannon frequently plots AVWAPs from the most recent swing high, the most recent swing low, the start of the current trend, and the prior major top or bottom simultaneously. Where these lines converge or diverge tells a richer story than any single line alone.
Pillar four: confluence with structure. AVWAP is never a standalone signal. It is one layer in a stack that includes horizontal support and resistance, trendlines, prior pivot points, and volume profile. When an AVWAP aligns with a horizontal level and a prior swing pivot, you have confluence. Confluence is where higher-probability setups live.
Shannon's anchor hierarchy (highest to lowest priority)
- All-time highs and all-time lows on the asset, which the entire market remembers.
- Major event candles: ETF approvals, halvings, network upgrades, regulatory rulings.
- Prior cycle highs and lows: bull market tops, bear market bottoms, multi-month range extremes.
- Breakout and breakdown candles from well-defined consolidation ranges.
- Recent swing highs and swing lows on your trading timeframe.
Anchor Point Selection: Where to Drop the Pin
Anchor selection is the single most important decision in using AVWAP. A great indicator with a bad anchor produces noise. A great anchor with even a basic AVWAP plot produces actionable context. Here are the categories of anchors that consistently produce useful signals in crypto, along with concrete examples from real markets.
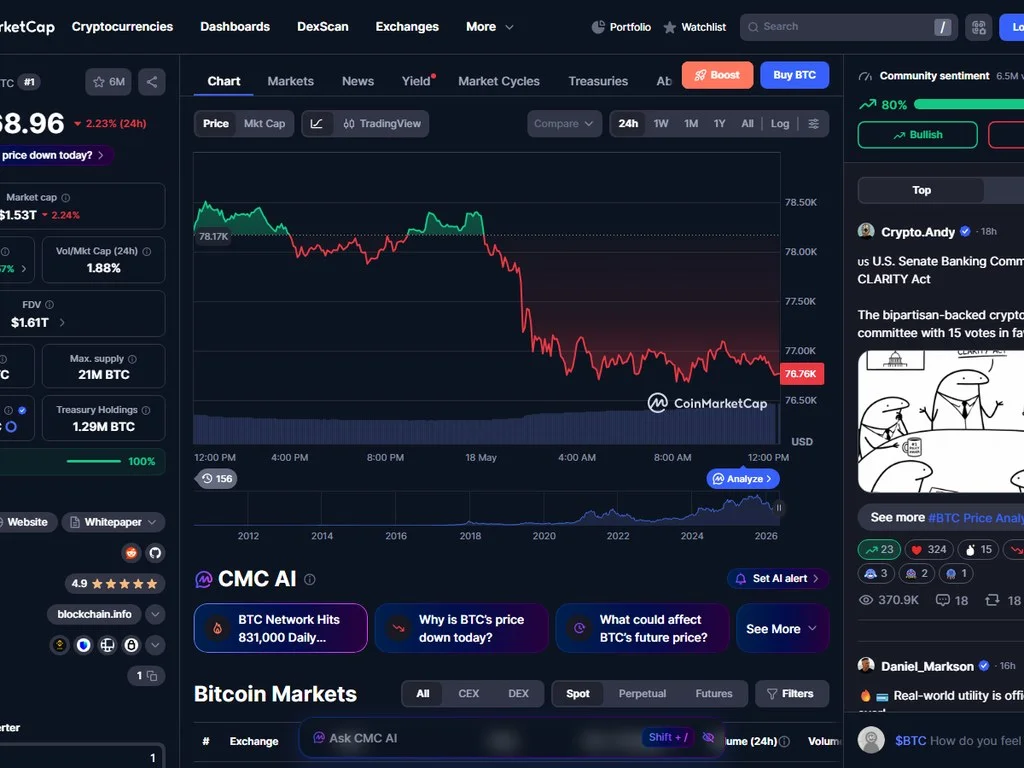
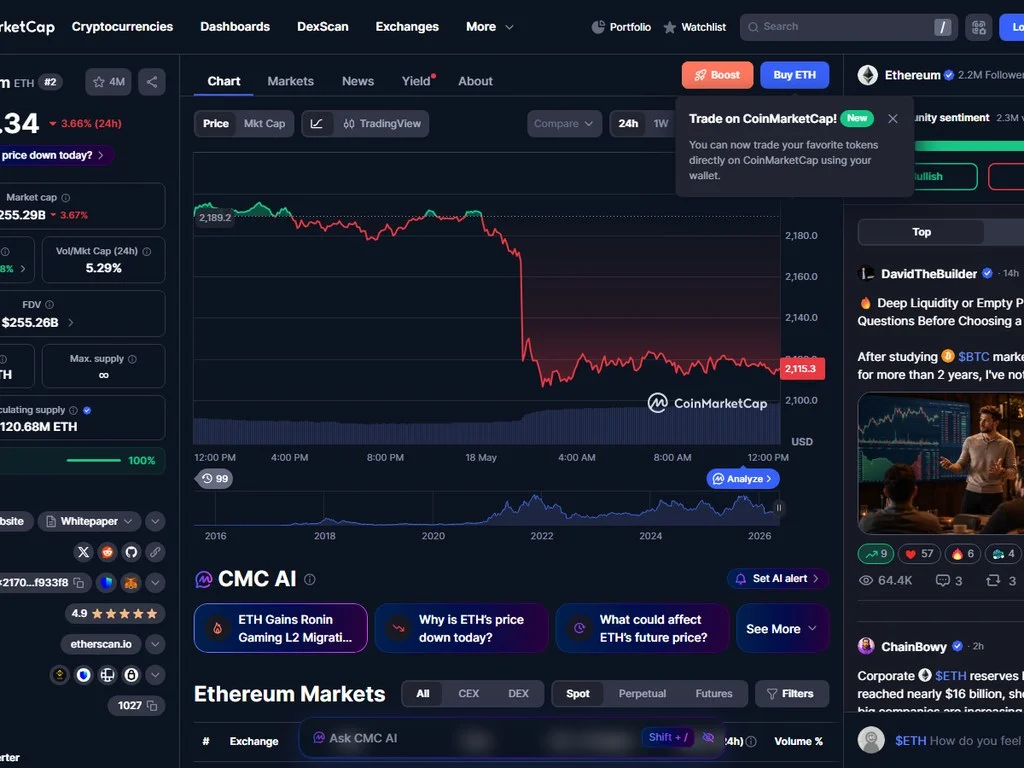
All-time highs and lows. Bitcoin's November 2021 high of roughly $69,000 is one of the most-watched AVWAP anchors in crypto. The line drawn from that bar represents the average price every dollar of volume has paid since the cycle top. Price trading above it signals broad recovery. Price trading below it signals the bear has not been resolved. The same logic applies to Ethereum's 2021 high, Solana's pre-FTX high near $260, and every major asset's cycle extremes.
Major event candles. The candle when the SEC approved spot Bitcoin ETFs in January 2024 is now permanently embedded in BTC's structure. AVWAP from that bar measures average participation in the post-ETF regime. Each Bitcoin halving event (most recently April 2024) provides a natural anchor for the cycle that follows. For Ethereum, the September 2022 Merge candle marked the transition to proof-of-stake and anchors the post-Merge era.
Token genesis or first listing. For newer tokens, the first candle of trading on a major exchange captures the entire historical average that early participants paid, useful for spotting tokens stretched far from their long-run accumulation average.
Breakout and breakdown candles. When an asset breaks out from a multi-week range on heavy volume, the breakout bar is a high-quality anchor. AVWAP from that bar tracks the average price participants have paid for the new regime. If price holds above the breakout AVWAP, the breakout is intact. If price loses it, the breakout is failing.
Memecoin launch candles. For memecoins and brand-new launches, the AVWAP from the very first traded bar is often the only meaningful reference because there is no prior structure to lean on. We cover the broader playbook in our guide to using burner wallets for airdrops and meme coins.
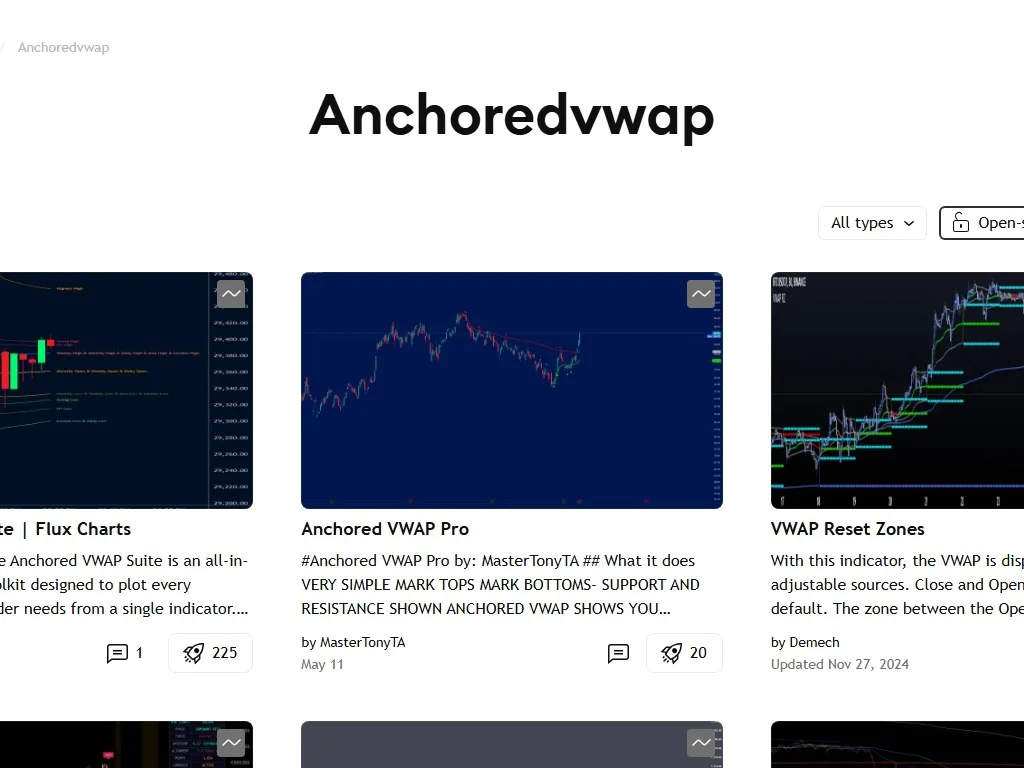
Step-by-Step: How to Plot Anchored VWAP on TradingView
TradingView ships AVWAP as a free, native indicator under the Drawing Tools section, not the Indicators menu. That confuses a lot of new users. Here is the exact workflow for plotting your first AVWAP and configuring it properly.
Load the asset and timeframe you want. AVWAP works on every timeframe, but anchor relevance grows with the timeframe. Daily and weekly charts produce the most reliable signals.
In the left-side drawing toolbar, click the prediction and measurement tools group. Select Anchored VWAP. Your cursor turns into a crosshair with a tag.
Click directly on the bar where your chosen event occurred. The all-time high candle, breakout bar, ETF approval candle, whatever you have selected. AVWAP draws instantly from that point.
Right-click the line and open settings. Set color, thickness, and label. Use distinct colors for different anchors so you can stack multiple AVWAPs without confusion.
Enable standard deviation or ATR bands in settings. These create a volatility envelope around AVWAP, useful for mean-reversion entries and exits.
Lock the drawing so you do not accidentally drag the anchor. Save the layout as a template so your AVWAP setup loads on every chart you open.
A few practical tips that experienced AVWAP users learn the hard way. Always anchor to the highest-volume bar within a candle cluster if the event spans multiple bars. The volume bar is where capital actually positioned itself. Use logarithmic price scaling on long-term charts because AVWAP lines spanning years can look distorted on linear scales. And never anchor "near" an event. Always anchor precisely on the bar of the event. A one-bar offset can shift the AVWAP path materially over long horizons.
AVWAP as Dynamic Support and Resistance
The most common reading of AVWAP treats the line as dynamic support or resistance, depending on which side of the anchor the trend has developed. The logic is intuitive. The line represents the average price every dollar of volume has paid since the anchor. Bars trading above the line mean the average participant is in profit. Bars trading below the line mean the average participant is at a loss. Markets care about that distinction.
When price approaches AVWAP from above after a sustained uptrend, the area is often defended by buyers because so many participants are sitting on profits and unwilling to let the position turn red. This creates a tendency for AVWAP to act as a support magnet during pullbacks. Conversely, when price approaches an AVWAP anchored from a high after a sustained downtrend, sellers tend to defend the area because so many participants are underwater and looking to exit at breakeven.
Crucially, AVWAP is not magic. It is a behavioral reference. Sometimes price slices through it on the first test. Sometimes it bounces off it repeatedly. The skill is reading the quality of the reaction. A high-volume bounce off AVWAP with a strong close is a much stronger signal than a low-volume drift back to the line. Pair this reading with the broader liquidation zone framework for a fuller picture of where forced flows might amplify the AVWAP reaction.
The AVWAP Rainbow: Stacking Multiple Anchors
Single AVWAPs are useful. Multiple AVWAPs stacked together are transformative. The technique, sometimes called the AVWAP rainbow, involves plotting four to six AVWAPs simultaneously from different significant anchors, each in a different color. The result is a map of average positioning across multiple time horizons.
For Bitcoin in 2026, a typical rainbow setup might include AVWAP from the November 2021 cycle high, AVWAP from the November 2022 FTX low, AVWAP from the January 2024 spot ETF approval candle, AVWAP from the April 2024 halving, and AVWAP from the most recent swing low. Each line represents a different cohort of market participants and a different question about positioning.
The magic happens at confluence zones. When three or four AVWAPs cluster within a narrow price range, that zone carries far more weight than any single line. Price approaching a confluence zone tends to produce sharper reactions, larger reversals, and more decisive breakouts than price approaching an isolated AVWAP. The rainbow effectively highlights the price levels where the largest concentration of average participants live, which is exactly where the largest behavioral reactions tend to occur.
Reading the rainbow
- Tight cluster: high confluence, expect sharp reaction at the zone.
- Wide spread: low confluence, AVWAPs disagree about average price.
- Price above all AVWAPs: broad uptrend control, every cohort is in profit.
- Price below all AVWAPs: broad downtrend control, every cohort is underwater.
- Price between AVWAPs: regime transition, watch which lines flip to support and which fail.
AVWAP for Crypto: Why 24/7 Markets Change the Game
Crypto-specific considerations make AVWAP behave differently than it does in equities, and understanding these differences is the difference between using the tool well and misreading the signals.
No earnings, but plenty of catalysts. Equities have a structured catalyst calendar built around quarterly earnings releases. Crypto does not, but it has its own calendar: protocol upgrades, token unlocks, exchange listings, ETF decisions, and regulatory rulings. Each is a high-quality AVWAP anchor candidate.
Continuous trading distorts session VWAP. Because crypto never closes, standard session VWAP becomes ambiguous. Different exchanges use different session boundaries (UTC midnight, US equity open, Asian session open), producing inconsistent values. AVWAP sidesteps the problem entirely by ignoring sessions.
Volume data quality matters more. AVWAP is only as good as the volume data feeding it. Wash trading on lower-tier exchanges can distort the line. For Bitcoin and major altcoins, use AVWAP on aggregated indices or dominant spot venues (Coinbase, Binance, Kraken). See our guide to detecting fake volume on crypto charts for venue selection.
Memecoins are a special case. Memecoins often launch with extreme initial volume that dominates the AVWAP calculation for weeks afterward. AVWAP from the launch candle tells you whether the entire history of trading is in profit or underwater, often more predictive than any other indicator. Combine this with basic on-chain hygiene when trading these markets.
AVWAP Bands: Adding Volatility Context
AVWAP by itself gives you a single line. AVWAP with bands gives you a volatility envelope. Most TradingView implementations let you toggle standard deviation bands at 1, 2, and 3 deviations from the AVWAP line, or ATR-based bands that scale with average true range.
Standard deviation bands compress the band width during low-volatility periods and expand it during volatility spikes, similar to Bollinger Bands. The difference is that the centerline is volume-weighted from a meaningful anchor instead of a simple 20-period moving average. That makes the bands more contextually relevant when the underlying thesis is event-driven.
ATR bands offer an alternative weighting that some traders prefer for crypto specifically because ATR captures crypto's tendency for asymmetric volatility better than standard deviation does in fat-tailed regimes. The bands act as practical reference levels for mean-reversion entries when price extends to the outer band and momentum continuation when price rides the band during strong trends.
Trading Strategies: Mean Reversion vs Trend Following
AVWAP supports two distinct strategy archetypes that are conceptually opposite but mathematically compatible.
Mean reversion with AVWAP. In ranging or consolidating markets, price tends to oscillate around AVWAP. Mean-reversion traders use deviations from AVWAP as entry signals, looking to buy when price extends below the line on weakening momentum and sell when price extends above on weakening momentum. The further price extends from AVWAP and the more confluence with bands or structure, the higher-probability the reversion trade becomes. Stops typically sit just beyond the outer deviation band. Targets sit at or just past the AVWAP line itself.
Trend following with AVWAP. In trending markets, AVWAP acts as the dynamic support or resistance for the dominant trend. Trend followers buy pullbacks to AVWAP in uptrends and short rallies into AVWAP in downtrends. The thesis is that trend control persists until price decisively closes on the wrong side of AVWAP with confirming volume. Stops sit a defined distance beyond the AVWAP, and trade management often involves trailing as the AVWAP itself rises or falls with the trend.
The challenge for the trader is correctly identifying which regime is active. Tools like ADX, volatility filters, and structural analysis help, but ultimately regime classification is a judgment call. Most experienced AVWAP users default to trend-following bias when price is making higher highs and higher lows around a rising AVWAP, and reversion bias when price is range-bound and AVWAP is flat. Pairing this with disciplined position sizing and an understanding of going long vs short in crypto closes the loop on execution.
AVWAP vs Bollinger Bands vs Moving Averages
AVWAP overlaps conceptually with other trend and volatility tools, but each has a distinct purpose. Understanding the differences clarifies when to reach for which tool.
AVWAP and moving averages can coexist on the same chart because they answer different questions. A 200-day SMA tells you where the average price has been over the last 200 days regardless of when the trend started. An AVWAP from the trend's actual starting bar tells you where the volume-weighted average has been since the trend began. Both perspectives are useful. Neither replaces the other.
AVWAP and Bollinger Bands also pair well. Bollinger Bands give you volatility context around a rolling mean. AVWAP gives you positional context around an event-anchored mean. Plotting both reveals when price is stretched simultaneously from its short-term rolling average and from its event-based reference, which is often a high-probability reversion setup.
Real Chart Case Studies: BTC, ETH, SOL
Theory matters less than application. Three case studies show how AVWAP reads in practice on the largest crypto assets.
Bitcoin: the cycle high AVWAP. The most-watched AVWAP in crypto is the line drawn from Bitcoin's November 2021 high. For more than two years, that AVWAP acted as overhead resistance, capping every rally attempt during the bear market. In early 2024, on the back of spot ETF approvals, BTC finally reclaimed the cycle-high AVWAP on heavy volume. Traders who used AVWAP recognized it in real time. Those who relied only on moving averages saw a much later signal.
Ethereum: the Merge AVWAP. Ethereum's September 2022 transition to proof-of-stake created a permanent structural anchor. AVWAP from the Merge candle has been a key reference for whether the post-Merge regime is in net accumulation or distribution, with each reclaim and rejection providing meaningful swing-trading signals.
Solana: the FTX bottom AVWAP. Solana crashed to roughly $8 in late 2022 following the FTX collapse, after trading above $260 the prior year. AVWAP from that capitulation bottom has been one of the most powerful trend references in crypto since. SOL's recovery through 2023, 2024, and 2025 unfolded with the FTX-bottom AVWAP acting as dynamic support during every meaningful pullback.
AVWAP Confluence Framework
Single signals are weak. Confluence is strong. The AVWAP confluence framework is a discipline for stacking AVWAP signals with other forms of evidence before taking action.
A complete confluence stack typically includes the AVWAP itself, a horizontal support or resistance level from prior price action, a volume-based reference such as a high-volume node from volume profile, and a structural read such as a Fibonacci retracement or trendline. When all four align within a tight zone, the probability of a meaningful reaction increases materially. When only one or two align, the read is weaker and position sizing should reflect that.
This is also where AVWAP pairs naturally with backtesting. Before deploying any AVWAP-based strategy with real capital, walk it through historical data to understand how often the setup produces wins, losses, and breakevens. Our guide to backtesting in crypto covers the methodology in depth and is essential reading before relying on any technical framework, AVWAP included.
Common Mistakes Traders Make with AVWAP
Most AVWAP failures trace back to a small set of recurring errors. Avoiding them puts you ahead of the majority of users.
Choosing an anchor because the resulting line looks clean afterward, rather than because the anchor bar represented a real market event. This is the cardinal sin.
Expecting AVWAP to hold support or resistance on every test. It will not. It is a behavioral reference, not a guarantee.
Moving the anchor every few candles defeats the purpose. Anchors should be tied to real events and should remain fixed for the entire life of the thesis.
Using AVWAP on low-quality data sources where volume is washed or thin produces a line that means nothing. Always use reputable venues.
Relying on one AVWAP in isolation ignores the richer picture that stacking multiple anchors provides. The rainbow exists for a reason.
Acting on AVWAP signals without checking horizontal levels, prior pivots, and volume profile. AVWAP is one layer in a confluence stack, not the whole stack.
Best Practices Checklist
Before you take an AVWAP-based trade
- Is your anchor tied to a real, market-recognized event?
- Does the AVWAP align with horizontal support or resistance?
- Does the AVWAP align with a prior pivot or structural level?
- Do multiple AVWAPs cluster in a confluence zone at this price?
- Is volume confirming the reaction at the AVWAP?
- Is your stop placed beyond a logical invalidation, not just beyond the line?
- Have you sized the position based on the distance to invalidation, not on conviction?
- Have you defined the conditions that would invalidate the AVWAP thesis?
AVWAP and Market Microstructure
AVWAP gains additional power when paired with an understanding of who is on the other side of your trade. Market makers and institutional desks benchmark execution against VWAP-family references, which creates a mechanical reason for large flows to defend or attack AVWAP levels. Retail traders who recognize this behavior can position alongside institutional flows. The guide on how crypto market makers operate provides essential context for why AVWAP zones often produce sharper reactions than purely retail-driven levels.
Frequently Asked Questions
Q Q What is anchored VWAP in simple terms?
Anchored VWAP is a volume-weighted average price line that you start from any bar on the chart you choose, such as an all-time high, a breakout candle, or a major news event. From that anchor forward, it tracks the average price every dollar of volume has paid, giving you a precise reference for where the market is positioned relative to the event that mattered.
Q Q Who invented or popularized anchored VWAP?
The concept of anchoring VWAP to custom points was explored by Paul Levine in the 1990s, but the methodology was formalized and popularized by Brian Shannon in his 2023 book Maximum Trading Gains with Anchored VWAP. Shannon turned AVWAP into a complete framework with rules for anchor selection, multi-AVWAP stacking, and trend identification.
Q Q How is anchored VWAP different from regular VWAP?
Standard VWAP resets at the start of every trading session and is designed for intraday execution benchmarking. Anchored VWAP never resets and starts calculating from a user-chosen bar, making it suitable for swing trading, position trading, and any timeframe from intraday to weekly. AVWAP gives you flexibility that session VWAP cannot.
Q Q How do I plot anchored VWAP on TradingView?
Open your chart, find the Anchored VWAP tool in the left-side drawing toolbar (it lives under the prediction and measurement tools group, not the indicators menu), click on the specific bar you want to anchor to, and the indicator draws instantly. Right-click the line to style it, add bands, and lock the drawing so the anchor cannot be moved accidentally.
Q Q What are the best anchor points for AVWAP in crypto?
The highest-quality anchors are events the entire market remembers: all-time highs, all-time lows, ETF approval candles, halving dates, major exchange listings, and decisive breakouts or breakdowns from multi-week ranges. For newer tokens and memecoins, the first traded bar is often the only meaningful anchor. Avoid anchoring to random bars just because the resulting line looks clean.
Q Q Can anchored VWAP act as support and resistance?
Yes, and this is one of its primary uses. When price trades above an AVWAP from a meaningful low, the line tends to act as dynamic support during pullbacks because the average participant is in profit and tends to defend the position. When price trades below an AVWAP from a meaningful high, the line tends to act as dynamic resistance because underwater participants tend to sell into rallies that approach breakeven.
Q Q What is the AVWAP rainbow strategy?
The AVWAP rainbow is a technique that involves plotting four to six AVWAPs from different significant anchors simultaneously, each in a different color. The lines together form a map of average positioning across multiple events and time horizons. Confluence zones where multiple AVWAPs cluster within a narrow price range tend to produce sharper market reactions than any single AVWAP alone.
Q Q Does anchored VWAP repaint?
No, AVWAP does not repaint historical values once a bar has closed. The line is fixed for all closed bars and only the most recent unconfirmed bar can shift as live volume continues to print. This makes AVWAP a reliable tool for both backtesting and live trading, unlike some indicators that revise historical signals.
Q Q Why does anchored VWAP work especially well in crypto?
Crypto markets trade 24/7 with no opening or closing bell, which makes standard session VWAP arbitrary and confusing across exchanges. Crypto is also dominated by discrete events like ETF approvals, halvings, protocol upgrades, and token launches, all of which are high-quality anchor candidates. AVWAP replaces missing session structure with event-driven references that map directly to crypto's actual market dynamics.
Q Q How does AVWAP compare to Bollinger Bands?
Bollinger Bands wrap a volatility envelope around a rolling simple moving average, useful for spotting volatility expansion and short-term mean reversion. Anchored VWAP provides an event-based reference weighted by volume rather than time, useful for trend identification and dynamic support and resistance from specific market events. The two tools complement each other and are often plotted together on the same chart.
Q Q Can I use anchored VWAP for memecoins and new launches?
Yes, and AVWAP is often the cleanest available reference for brand-new tokens because there is no prior price structure to lean on. Anchor the AVWAP to the very first traded bar after launch. The resulting line tells you the average price every dollar of historical volume has paid, which is a powerful proxy for whether the entire trading history is in profit or underwater.
Q Q Is anchored VWAP useful for short-term day trading?
Yes, although day traders typically combine AVWAP with standard session VWAP rather than choosing one over the other. Common intraday AVWAP anchors include the previous day's high, the previous day's low, the opening bar of the current session, and any high-volume bar that marked a regime change during the day. The principles are the same as on longer timeframes, just applied to faster anchors.
Conclusion: Why AVWAP Belongs in Every Crypto Trader's Toolkit
Anchored VWAP is not a magic indicator. No indicator is. But it solves a specific problem that no other tool solves as cleanly: it tells you where the volume-weighted average market participant has been positioned since the event that actually mattered to your thesis. That is a fundamentally different question from anything moving averages, Bollinger Bands, or oscillators answer.
For crypto traders specifically, the case for AVWAP is even stronger than for equities. The 24/7 market structure makes session VWAP awkward, the steady stream of discrete catalysts produces abundant high-quality anchor candidates, and the prevalence of event-driven regimes means that volume-weighted reference levels often dominate price action for weeks or months at a time.
The path from beginner to proficient AVWAP user is straightforward. Master anchor selection. Plot single AVWAPs from significant events. Add a second and third AVWAP to build the rainbow. Layer in horizontal structure and volume profile for confluence. Backtest before deploying capital, and respect the tool for what it is: a high-quality context indicator, not a crystal ball. Combine AVWAP with the rest of your foundational crypto knowledge and wallet security practices, and you will have a framework that competes with what professional desks use.
Continue your technical analysis education
Disclaimer: This article is for educational purposes only and does not constitute investment, financial, legal, or trading advice. Anchored VWAP is a context tool, not a guarantee. Always conduct your own research and consult with a qualified financial professional before making trading decisions.
Related Guides
- What Is VWAP in Crypto? Complete Indicator Guide 2026
- What Is Plasma (XPL)? Bitcoin-Anchored Stablecoin Layer 1 Guide 2026
- When Not to Trade: 12 Red Flags Every DeFi Trader Should Know
- What Is a Market Maker in Crypto: Complete Trader Guide (2026)
- What Is the Crypto Fear and Greed Index: Complete Trader Guide (2026)