Exchange Netflow: Digital Market Inventory

Blockchain transparency allows market participants to track inventory shifts in real time. We break down the data loops and telemetry behind exchange netflow metrics.
Exchange Netflow: Tracking the Digital Inventory of Global Markets
- In traditional equities markets, institutional inventory shifts are heavily cloaked behind private dark pools, clearinghouse custody accounts, and delayed quarterly filings. Retail participants are frequently left blind to the accumulation or liquidation patterns of market makers until long after the price trends have resolved. The transparency of public blockchain architecture completely flips this dynamic.
- Every centralized asset exchange utilizes a specific, discoverable architecture of deposit, hot, and cold storage wallets. By monitoring these public ledgers, data analysts can calculate the real-time velocity of assets moving onto and off of exchanges.
- This continuous tracking framework is summarized by a single, vital metric: Exchange Netflow. For modern macro and spot traders, decoding netflow data is the ultimate prerequisite for diagnosing structural supply shocks, identifying hidden institutional accumulation, and anticipating imminent market sell pressure.
1. The Mathematical Core: Deconstructing Exchange Netflow Telemetry
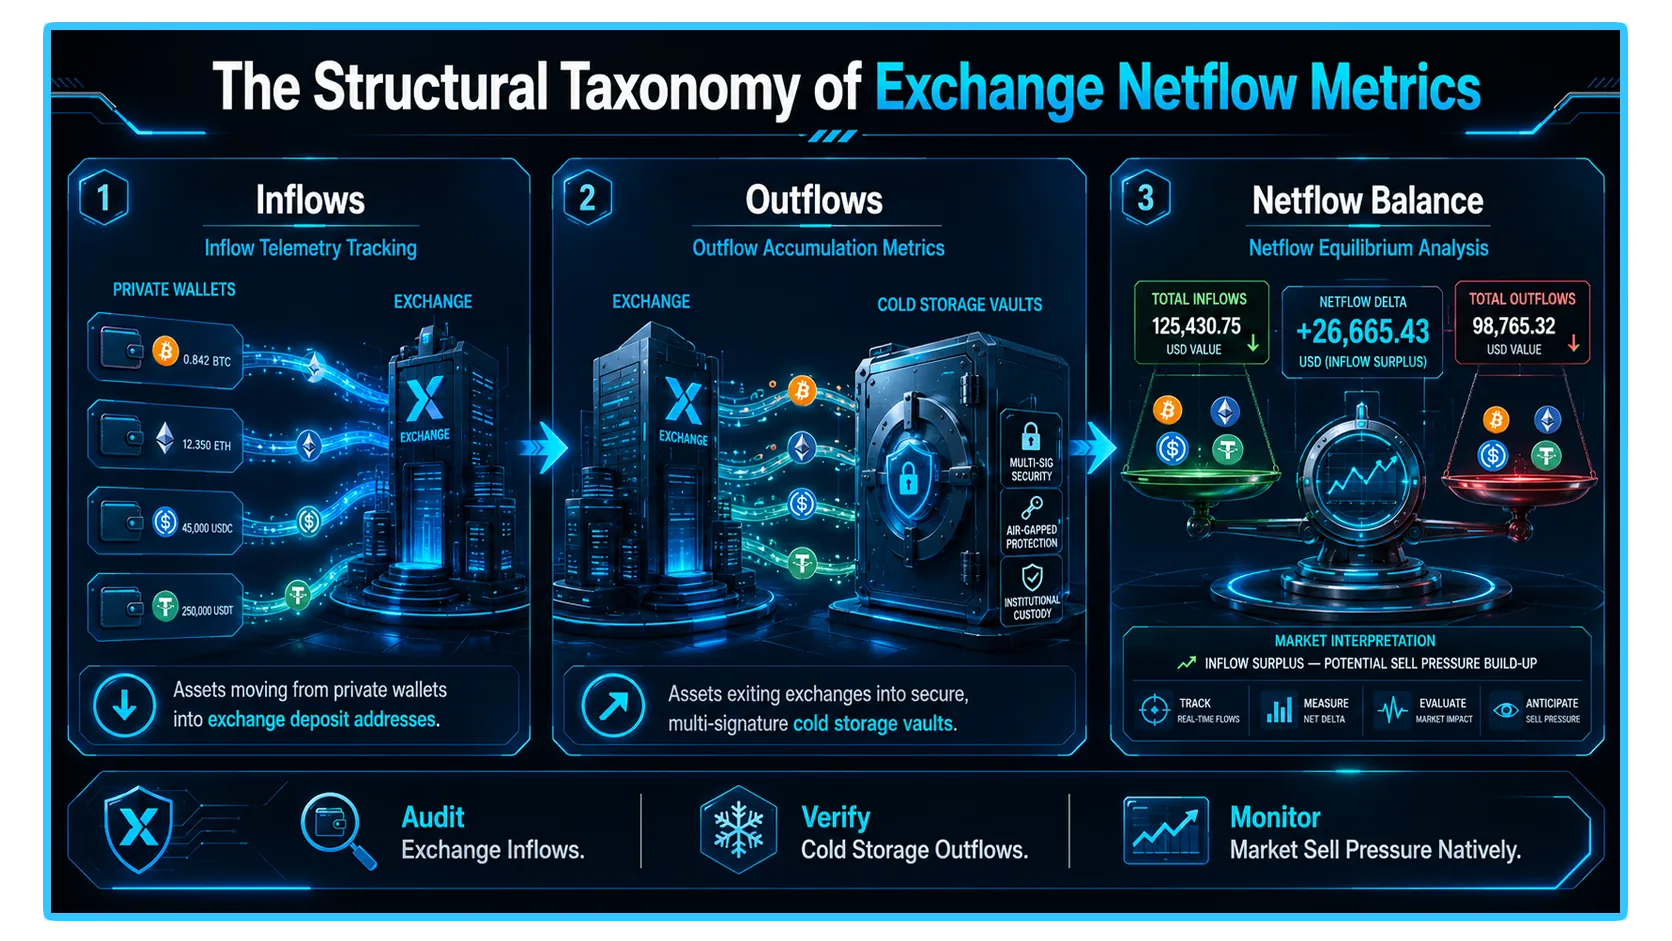
To evaluate exchange inventory data with quantitative precision, you must isolate the two transactional vectors that define the net movement of capital: Inflows and Outflows.
Let's talk about Exchange NetFlow and its derivatives.
Exchange Inflows
An inflow occurs when an external, independent blockchain wallet executes a transaction to transfer assets into a deposit address controlled by a centralized exchange. Because holding assets on a centralized exchange subjects the user to custody risks, investors typically only move their tokens onto exchanges for two primary reasons: to use them as margin collateral for derivative leverage, or to execute a market sell order. Consequently, massive spikes in exchange inflows are structurally interpreted as a leading indicator of rising Sell Pressure.
Exchange Outflows
An outflow represents the inverse operation. It occurs when an entity withdraws assets from an exchange wallet, routing them to an external, self-custodied hardware wallet, multi-sig setup, or decentralized smart contract. Investors pull assets off exchanges when they intend to hold them for an extended timeline, shielding them from platform insolvency risk. Therefore, sustained exchange outflows signal active market Accumulation and a tightening of the circulating float.
2. The Netflow Equation and Signal Interpretation
The ultimate Netflow metric on Exchange Netflow synthesizes these two distinct data streams into a single, real-time momentum indicator. The baseline calculation is defined by an exact mathematical formula:
By monitoring the output of this equilibrium equation, market analysts can map out two clear-cut market regimes.
Positive Netflow Regimes (+)
When the netflow value trends firmly above zero, it demonstrates that the volume of incoming assets exceeds the volume of withdrawals. This expanding exchange inventory implies that market participants are positioning themselves to liquidate assets. If a major positive netflow spike occurs following a multi-month market rally, it frequently signals that early institutional allocators are preparing to lock in profits, warning disciplined traders to reduce local portfolio risk.
Negative Netflow Regimes (-)
When the netflow calculation slides deeply into negative territory, it reveals that capital is exiting exchange ledgers faster than it is entering. This macro contraction of available trading inventory triggers a structural "supply shock." With fewer tokens resting on order books to satisfy incoming spot demand, any sudden wave of subsequent buying pressure can accelerate rapid, upward price expansions, as buyers are forced to bid higher to clear thin ask-side depth.
3. Nuances in the Data: Sifting Signal From Noise
An institutional-grade application of Netflow analytics requires you to look past raw headline figures. Blindly shorting every positive netflow alert or longing every negative spike will inevitably expose a portfolio to toxic slippage and false assumptions. Advanced allocators segment the data across three critical filters:
The Exchange Typology Filter (Spot vs. Derivatives)
The systemic meaning of an inflow depends heavily on the operational profile of the target venue.
Spot Exchanges (e.g., Coinbase): Inflows here are explicitly bearish, as these venues exist purely to facilitate immediate asset liquidation and fiat fiat cash-outs.
Derivatives Exchanges (e.g., Binance Perps): Inflows onto leverage-heavy venues often indicate that traders are depositing assets to use as collateral to open massive long or short perpetual futures contracts. If open interest spikes alongside derivative inflows, the volatility risk skyrockets, but it does not inherently mean spot liquidation is occurring.
The Stablecoin Variance Loop
When evaluating stablecoin assets like USDT and USDC, the Netflow interpretation rule completely reverses:
| Asset Class | Positive Netflow (+) Impact | Negative Netflow (-) Impact |
| Volatile Cryptocurrencies (BTC, ETH, SOL) | Potential Sell Pressure (Bearish) | Inventory Contraction / Supply Shock (Bullish) |
| Fiat-Backed Stablecoins (USDT, USDC) | Dry Powder Accumulation / Buying Power (Bullish) | Capital Flight / Market Capital De-Risking (Bearish) |
A massive positive netflow spike of stablecoins into centralized venues reveals that investors are moving their fiat-proxies onto order books to prepare for asset accumulation. This accumulation of "dry powder" functions as an aggressive leading indicator for incoming spot market buy-side demand.
4. Strategic Synthesis with On-Chain Telemetry
- While tracking inventory shifts on centralized exchanges provides a clear macro view of institutional positioning, modern capital distribution is increasingly managed via decentralized venues. Advanced traders cross-reference centralized netflow shifts with live decentralized spot market analytics to isolate optimal trading execution windows.
- DEXTools provides the critical analytical infrastructure necessary to bridge these data environments. By utilizing real-time pair explorers, multi-chain order book data tracking, and comprehensive whale wallet flow monitoring, participants can instantly verify whether the supply shocks predicted by centralized negative netflow metrics are actively manifesting as real-world buy volume across automated market makers. Cross-referencing centralized exchange telemetry with live decentralized liquidity mapping ensures your risk management frameworks are anchored by authentic macroeconomic depth, keeping your portfolio insulated from deceptive market anomalies.
Disclaimer: This article is for informational purposes only and does not constitute investment advice, financial advice, trading advice, or any other kind of advice. DEXTools does not recommend buying, selling, or holding any cryptocurrency or token. Users should conduct their own research and consult with a qualified financial advisor before making any investment decisions. Cryptocurrency investments are volatile and high-risk. DEXTools is not responsible for any losses incurred.