Exit Liquidity Mapping: Who Might Sell Into You Before You Buy?
— By Whatsertrade in Tutorials

Every trader wants to buy before the move. Nobody wants to become exit liquidity for someone else. In decentralized exchange trading, this risk is especially im
Every trader wants to buy before the move. Nobody wants to become exit liquidity for someone else. In decentralized exchange trading, this risk is especially important because many tokens move quickly, liquidity can be thin, and early wallets may hold large unrealized gains.
Exit liquidity mapping is the process of identifying who might sell into the market before you enter. It helps traders think beyond the chart and ask a critical question: if I buy now, who is waiting above me with a better entry and a reason to sell?
This does not mean every early holder is dangerous. Profit taking is normal. The goal is to understand potential sell pressure before it becomes visible on the chart.
What Exit Liquidity Means
Exit liquidity refers to buyers who provide the demand that allows earlier holders to sell. In simple terms, if someone bought early and wants to take profit, they need later buyers to absorb their tokens. When new traders enter during hype, they may unintentionally become the exit path for earlier wallets.
This is common in volatile token launches, memecoins, and narrative driven markets. A token may look strong because price is rising, but if many early wallets are sitting on large gains, the rally may also attract selling.
Exit liquidity mapping helps traders see this risk before entering.
Why Mapping Sell Pressure Matters
Price alone does not show who owns the supply. A chart can look bullish while several wallets hold enough tokens to create major downside pressure. If those wallets begin selling into new buyers, the chart can reverse quickly.
Mapping potential sell pressure helps traders improve timing, position sizing, and risk management. It also helps separate clean momentum from momentum that is being used as an exit window.
A trader does not need perfect information. Even a basic review of concentration, wallet behavior, liquidity, and recent sells can improve decision making.
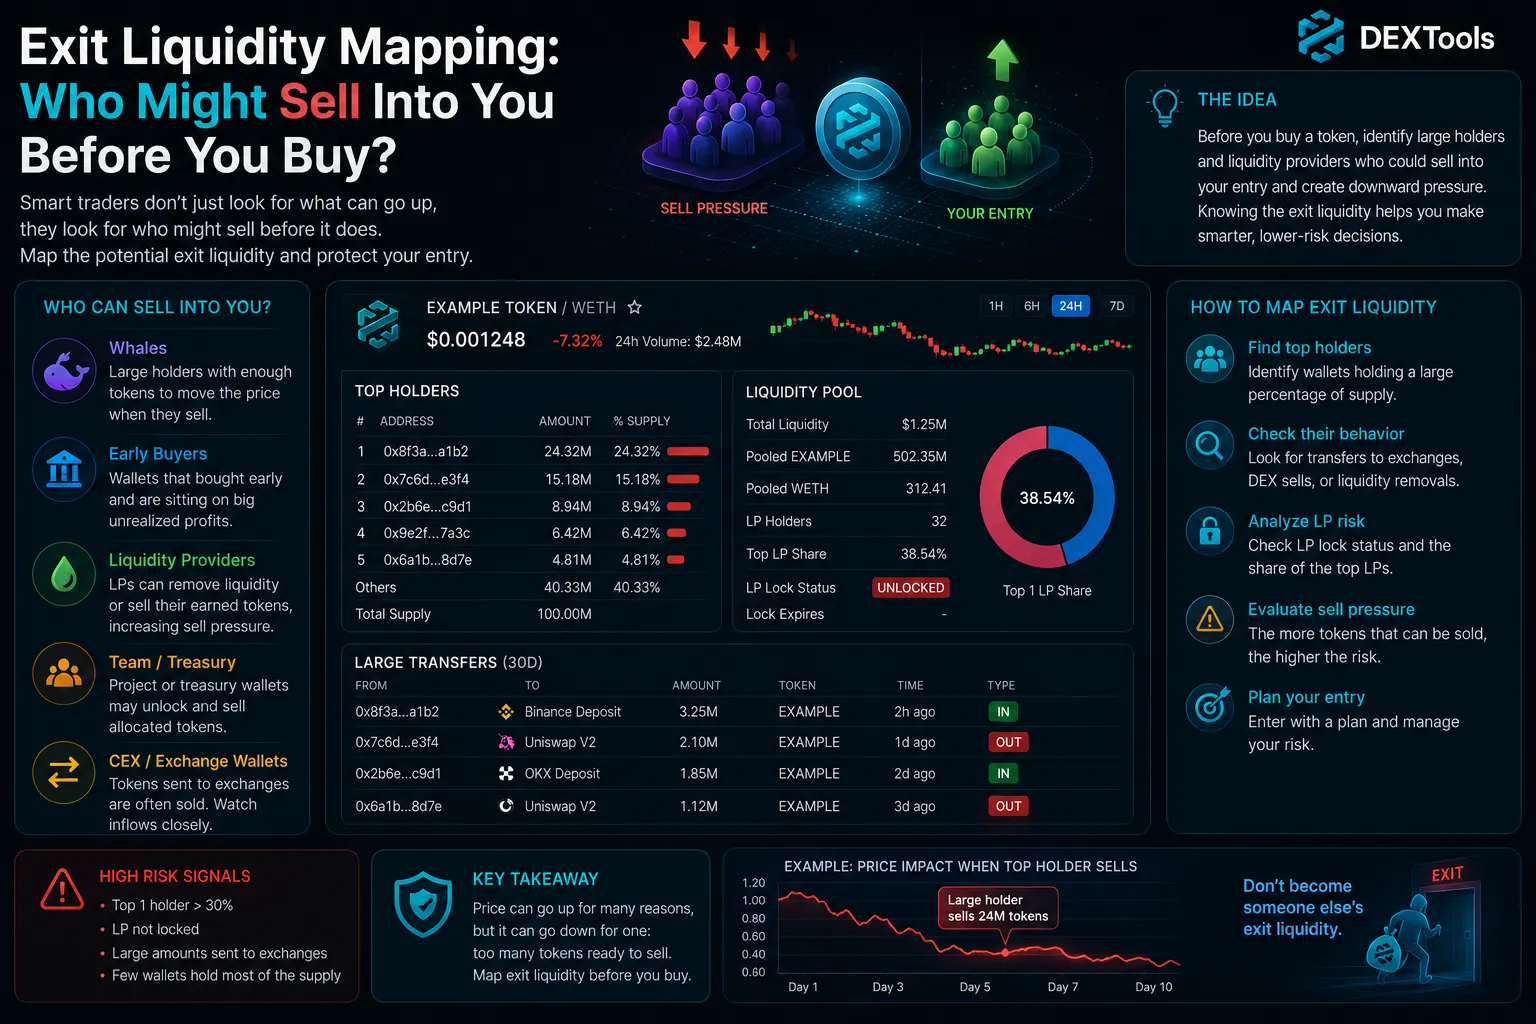
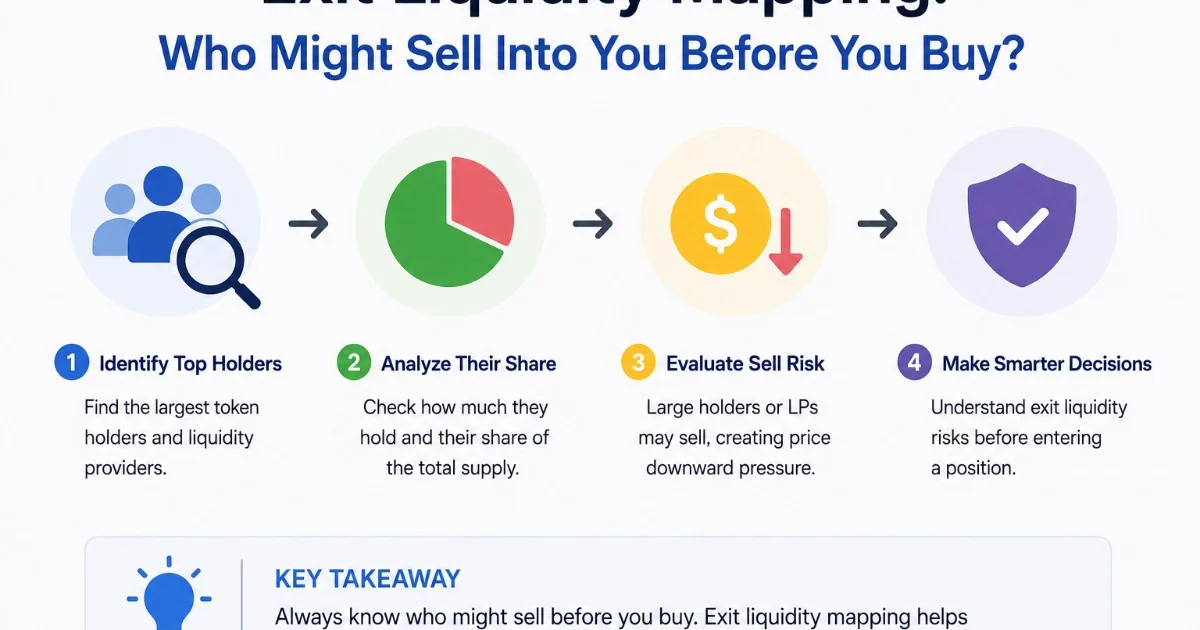
Step 1: Identify Concentrated Holders
The first step is to check whether the token supply is concentrated. If a small number of wallets hold a large percentage of tokens, the market may be exposed to sudden selling. Concentration is not always negative. Some wallets may be locked, team controlled, treasury based, or exchange related. But every large wallet deserves context.
Traders should ask whether major holders are known, whether their tokens are locked, whether they have sold before, and whether their holdings are large compared with current liquidity.
The relationship between wallet size and liquidity is critical. A wallet holding $200,000 worth of tokens is a much bigger risk in a pool with $100,000 liquidity than in a pool with several million dollars of usable depth.
Step 2: Study Early Buyers
Early buyers often have the largest profit cushion. They can sell while still remaining profitable, even if later buyers are already underwater. This gives them flexibility and creates risk for traders entering after a major move.
Not all early buyers sell aggressively. Some hold for larger moves. Others sell gradually. The important question is whether early buyers have already started distributing.
If early wallets are selling small amounts into every pump, the token may be facing steady overhead pressure. If early wallets remain inactive while volume grows, the market may have more room to develop. If one large early wallet begins selling suddenly, the chart can change fast.
Step 3: Compare Sell Pressure With Liquidity
Potential sell pressure becomes more serious when liquidity is weak. A large holder may not be dangerous if the pool can absorb their selling. The same holder can be a major threat in a thin pool.
Traders should compare the size of large wallets with current liquidity and recent volume. If several wallets could each create major price impact, risk increases. If daily volume is strong and liquidity is deep, the market may be better able to absorb sells.
DEXTools helps traders monitor liquidity, volume, transactions, and price movement. These signals show whether the market can handle selling or whether it may break under pressure.
Step 4: Watch Selling Behavior During Green Candles
One of the clearest signs of exit behavior appears during green candles. If every price increase is met with large sells, earlier holders may be using new demand to exit. This does not always destroy a token, but it can slow momentum and create a heavy chart.
Traders should watch how price reacts after buys. Does the token continue climbing, or does it get sold down immediately? Are sells coming from many normal traders, or from a few repeated wallets? Does volume support the move, or is the rally mostly being absorbed by sellers?
The way a token behaves during strength often reveals more than the way it behaves during weakness.
Step 5: Look for Unlocks, Vesting, and Treasury Risk
Sell pressure can also come from scheduled unlocks, vesting wallets, treasury wallets, marketing wallets, or liquidity related wallets. These wallets may not sell immediately, but they can influence market perception.
If traders know that a major unlock is coming, they may sell in advance. If a treasury wallet moves tokens without explanation, confidence can weaken. If marketing wallets receive large amounts, traders may wonder whether future campaigns will create exit windows.
Exit liquidity mapping should include both current holders and future supply events.
How to Use DEXTools for Exit Liquidity Mapping
DEXTools can be used as the market layer of the analysis. Start with the token pair and review price, liquidity, volume, and recent transactions. Look for repeated large sells, sudden changes in liquidity, and price reactions after buying waves.
Then connect the market behavior with wallet research. If large wallets are selling while the chart is being promoted, risk increases. If large wallets are inactive and volume is organic, the setup may be cleaner.
The strongest analysis combines what the chart shows with what the wallets are doing.
Common Mistakes Traders Make
One mistake is assuming that rising price means low sell pressure. In reality, rising price can attract sellers. Another mistake is ignoring wallets that bought much earlier. These wallets can sell profitably even during what looks like a dip to new traders.
Some traders also focus only on the largest wallet. Smaller clusters can create serious pressure if they act together or share the same entry zone.
Exit liquidity risk is not always obvious. It often hides behind a bullish chart.
Conclusion
Exit liquidity mapping helps traders understand who might sell before they buy. By reviewing holder concentration, early buyers, liquidity depth, selling behavior, and future supply events, traders can avoid entering blindly into someone else's exit.
DEXTools provides the essential market view for this process. Price, volume, liquidity, and transaction data can reveal whether demand is strong enough to absorb potential sellers.
Before buying a token, do not only ask how high it can go. Ask who is already in profit, how much they hold, and whether your entry may become their exit.
How to Bridge Crypto Between Chains: Complete Cross-Chain Tutorial 2026 How to Use 1inch for Swaps: Classic, Fusion and Limit Orders (2026) OKX Web3 Wallet Tutorial 2026: Multi-Chain Setup GuideBeyond the Basics: Unmasking Hidden Exit Liquidity Patterns
While the concept of exit liquidity often brings to mind large, obvious sell walls, the reality in decentralized markets is far more nuanced. Sophisticated players, from early investors to strategic market makers, employ subtle tactics to offload positions without triggering immediate panic. Understanding these less overt patterns is crucial for any DEXTools user aiming to navigate the market with an edge.
One common misconception is that exit liquidity is solely about selling into a rising price. In fact, smart money often 'distributes' into range-bound consolidation periods or even during minor dips, using these less volatile times to slowly reduce their exposure without creating a dramatic price impact. This slow bleed can be harder to spot than a sudden dump, but it's equally effective at transferring risk to newer buyers.
Identifying Distribution Phases
Detecting these more subtle distribution phases requires looking beyond simple price action. Volume analysis, order book depth changes, and even the behavior of specific wallet addresses can offer valuable clues. It's a game of connecting the dots, not just reacting to the most obvious signals.
- Monitor long-term holders: Track addresses that received large allocations early on. Are they consistently sending small amounts to exchanges, even during periods of low volatility?
- Observe 'wash trading' patterns: Sometimes, large holders will execute small buys and sells against themselves to create artificial volume, masking their true intent to offload.
- Analyze depth chart 'thinning': If buy-side depth consistently decreases over time without a corresponding price drop, it could indicate a lack of genuine demand absorbing sellers.
- Watch for 'block trades' on centralized exchanges: While DEXTools focuses on DEXs, significant block sales on CEXs can precede or coincide with distribution on DEXs, often by the same entities.
- Look for 'fakeouts' after news: Positive news often creates a temporary pump. Smart money might use this brief euphoria to offload, knowing retail will chase the momentum.
Related Guides
- Whale Buy or Exit Liquidity? How to Read Big Swaps Without Blindly Copying Whales
- How to Check Buy and Sell Tax Before Buying a Token (2026)
- Exit Liquidity Signals: Spot Late Entry Risks
- Top 5 NFT Marketplaces in 2026: Where to Buy and Sell Digital Assets
- How to Use MoonPay to Buy and Sell Crypto: Beginner Guide (2026)
- The Silent LP Exit
Frequently Asked Questions
What is exit liquidity in crypto trading?
Exit liquidity refers to the capital provided by buyers that allows earlier investors or traders to sell their assets and realize profits. When you buy a cryptocurrency, you are providing exit liquidity for someone who is selling.
Why is it important to understand exit liquidity before buying?
Understanding exit liquidity helps you identify potential risks. If you buy into a token where many early investors are looking to sell, your purchase might primarily serve to allow them to exit, potentially leading to price depreciation after your entry.
How can I identify potential sellers who might create exit liquidity?
You can analyze on-chain data to look for large, early holders or wallets that received significant allocations during private sales or presales. Tools that track token distribution and whale movements can provide insights into who might be looking to sell.
What are the risks of becoming exit liquidity?
The primary risk is buying an asset at a price that subsequently drops because a large volume of earlier investors sell their holdings, using your capital to exit. This can lead to significant losses for you as the later buyer.