Liquidity to Market Cap Ratio: Spotting Risky Tokens
— By AliceOnChain in Tutorials

Market capitalization can be a deceptive metric in decentralized finance. Discover how evaluating the liquidity to market cap ratio helps traders identify illiquid tokens, mitigate slippage, and detect potential rug pulls or whale manipulation before deploying capital.
Liquidity to Market Cap Ratio: Spotting Thin and Risky Tokens
Evaluating asset valuation in decentralized finance (DeFi) requires looking far beyond traditional metrics. In conventional stock markets, market capitalization provides a relatively reliable gauge of a company’s aggregate value. However, within the automated market maker (AMM) architectures of decentralized exchanges (DEXs), market capitalization can become a highly deceptive metric.
Without deep liquidity, a token with a massive fully diluted valuation can remain functionally untradable at scale. For decentralized network participants and traders, understanding the relationship between an asset's available liquidity and its market capitalization is an essential component of comprehensive risk management. This guide explores how to calculate, interpret, and leverage the liquidity to market cap ratio using advanced on-chain analysis to navigate volatile token markets safely.
Understanding the Liquidity to Market Cap Ratio
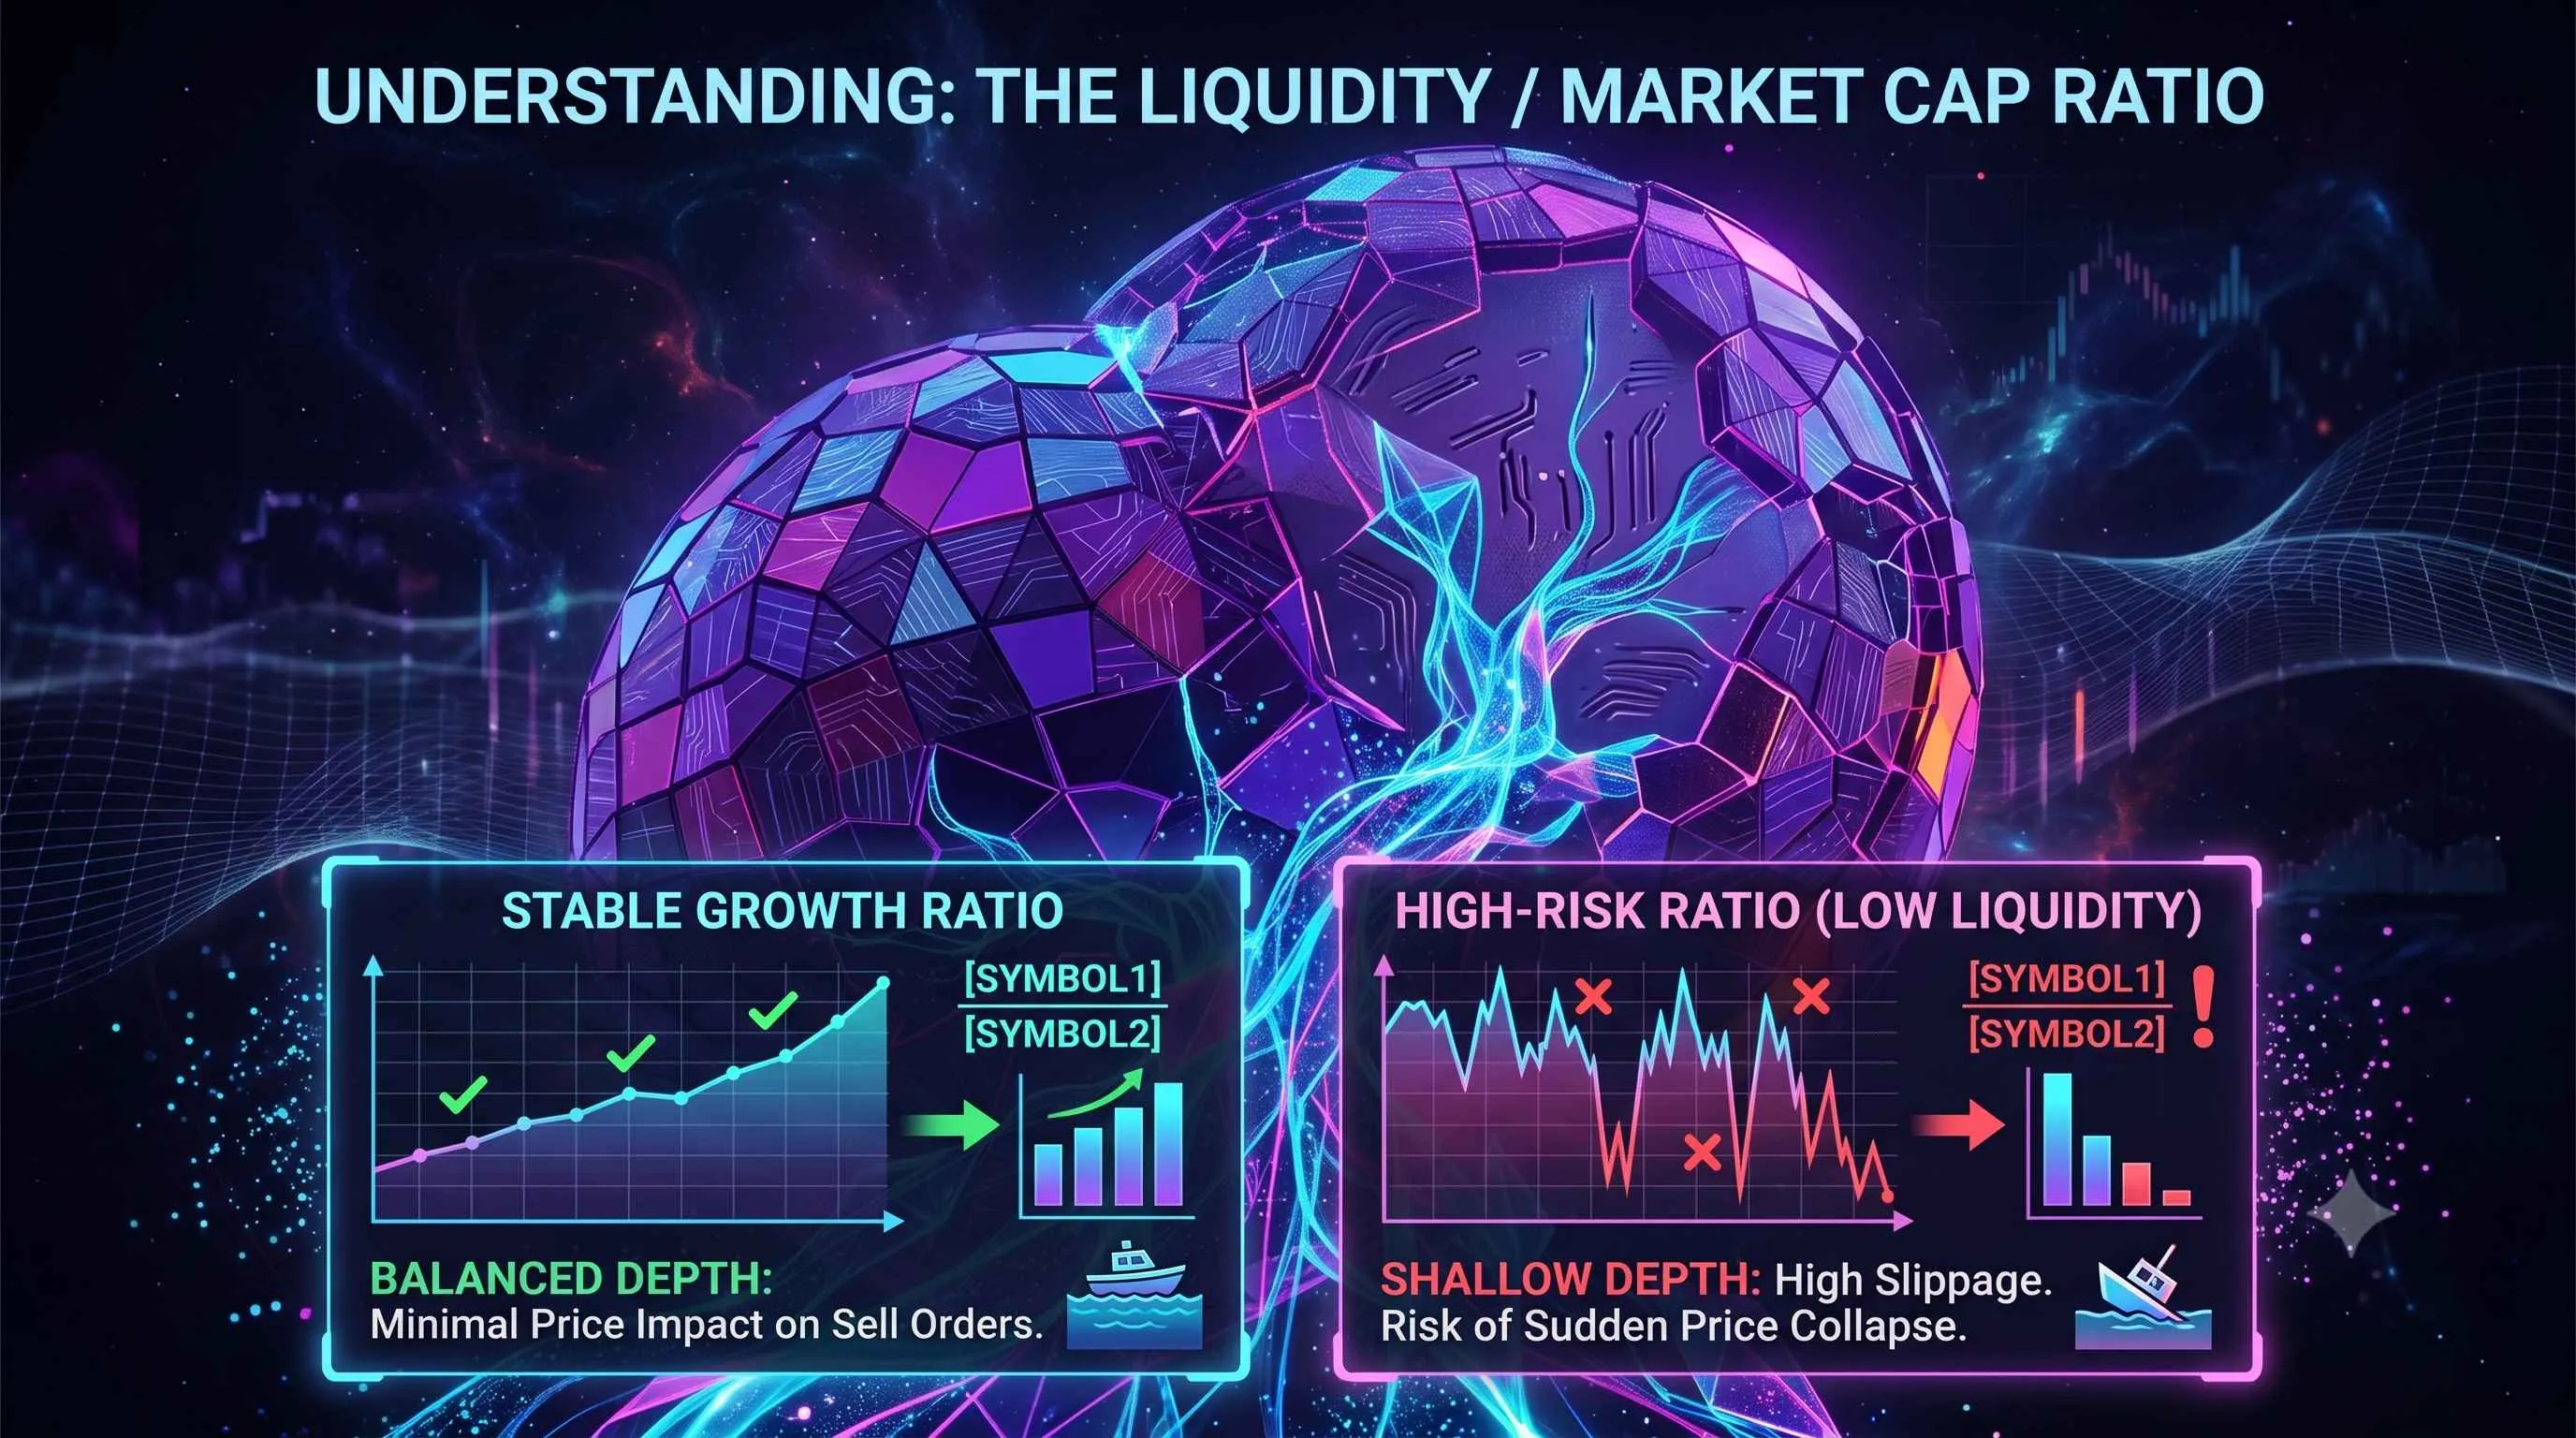
The liquidity to market cap ratio measures the proportion of a token's total market value that is backed by accessible, locked, or pooled assets in decentralized liquidity pools.
Market capitalization is calculated by multiplying the current token price by either its circulating or total supply. This metric represents a theoretical value; it assumes that every existing token could be liquidated at the current spot price.
In contrast, liquidity refers to the actual value of the pairs (such as ETH, USDC, or USDT) deposited into smart contracts to facilitate trading. The liquidity to market cap ratio is expressed mathematically as:
When evaluating this metric on platforms like DEXTools, look closely at the relationship between these numbers. If a project claims a market capitalization of $100 million but only has $100,000 in total pooled liquidity, its liquidity to market cap ratio is an incredibly fragile 0.001 (or 0.1%). This indicates a disproportionately thin market structure where minor selling pressure could trigger severe downside volatility.
Why High Market Capitalization Often Masks Structural Risk
In DeFi, creating a token with an artificially inflated market capitalization requires minimal capital. An entity can mint a token with a total supply of 1 billion units, pair 1 million tokens with $1,000 worth of ETH in a pool, and purchase a fraction of a token to establish a spot price of $1. Theoretically, the project now registers a $1 billion market capitalization, yet the actual capital supporting that valuation is negligible.
This discrepancy represents a low-liquidity trap. Retail traders often monitor top-gaining asset lists, observing aggressive upward price movement while overlooking the underlying pool depth. When the liquidity to market cap ratio is thin, minor buy orders cause exponential price spikes due to AMM bonding curves.
However, the reverse is equally true. When early insiders, developers, or localized whales decide to realize profits, the lack of depth means that selling even a microscopic fraction of the total supply can completely drain the pool, driving the price toward zero.
Step-by-Step Tutorial: Analyzing Liquidity Metrics on DEXTools
Identifying health indicators within liquidity pools requires a methodical review of live on-chain parameters. Utilizing the technical suite available via DEXTools, traders can systematically audit these metrics before committing capital.
Step 1: Isolate Core Metrics via Pair Explorer
Begin by entering the contract address of the target token into the DEXTools Pair Explorer. The interface aggregates live data directly from the underlying smart contracts. Focus your attention on three primary data fields located in the main info panel:
Total Liquidity: The aggregate dollar value of both assets residing within the specified liquidity pool.
Market Cap: The valuation based on current circulating or total supply.
24h Volume: The total dollar value of trades executed within the last 24-hour window.
Compare the total liquidity directly against the market cap. As a general baseline, a healthy, established utility token often maintains a liquidity to market cap ratio between 0.05 (5%) and 0.20 (20%). Ratios dropping significantly below 1% to 2% may indicate an elevated risk environment.
Step 2: Evaluate Volume to Liquidity Consistency
High trading volume paired with low liquidity creates an environment prone to violent price swings. Examine the 24-hour volume in relation to the pool's depth. If the daily volume exceeds the total liquidity by multiple factors while the liquidity to market cap ratio remains under 1%, the token is experiencing extreme speculative velocity. This dynamic can cause sudden trend reversals when momentum shifts.
Step 3: Assess Holder Distribution and Concentration
A token might exhibit an acceptable liquidity to market cap ratio on paper, but if the underlying asset distribution is heavily centralized, that ratio becomes compromised. Use the DEXTools Holder Analysis tab or integrate Bubblemaps to examine wallet architecture.
If a small cluster of non-exchange wallets controls a percentage of the circulating supply that exceeds the entire value of the liquidity pool, those specific holders possess the structural capacity to completely drain the pool. Cross-reference large wallet addresses against active trading behavior to spot coordinated distributions.
Correlating Liquidity Ratios with Advanced Technical Indicators
On-chain metrics yield the highest predictive value when mapped alongside traditional technical analysis on live charts.
Volatility Management and Support/Resistance Stability
Thin liquidity to market cap ratios fundamentally alter how support and resistance levels behave. In a deep market, historical support levels represent areas where dense buy orders sit in order books. In decentralized pools, support is determined by the mathematical depth of the AMM constant product formula ($x \times y = k$).
When a token has a low liquidity ratio, traditional support and resistance lines become fragile. A single market order can sweep through multiple perceived support zones, invalidating technical setups and triggering cascading stop-losses.
Identifying Divergences with Momentum Indicators
When analyzing price action via the Relative Strength Index (RSI) or Moving Average Convergence Divergence (MACD), low liquidity can introduce considerable market noise. For instance, a token may print a higher high on a price chart, but if that move occurred on declining trading volume and stagnant liquidity pool expansion, it often signals an exhaustive push.
If the RSI displays a bearish divergence while the liquidity to market cap ratio remains compressed, it suggests that the upward trajectory lacks real capital backing and may be vulnerable to a swift correction.
Monitoring Whale Activity and Price Alerts
Because thin tokens are highly sensitive to individual transactions, tracking large-scale wallet movements is critical. Utilize the Top Traders and live transaction logs on DEXTools to monitor the size of individual sell orders relative to the total liquidity.
Setting up proactive Price Alerts on assets with low liquidity ratios allows traders to react to sudden structural shifts immediately, rather than discovering a breakdown after a liquidity pool has already experienced a severe drawdown.
Market Sentiment and Real-World Scenarios
The liquidity to market cap ratio changes predictably across various stages of market cycles and sentiment shifts.
The Euphoria Phase vs. Structural Reality
During broader market expansions, capital flows rapidly into speculative or newly deployed assets. This influx of speculative demand can drive a token's market cap up exponentially within hours. If the creators or liquidity providers do not scale the underlying pool size proportionally, the liquidity to market cap ratio plummets. Experienced market participants recognize that a rapidly rising market cap accompanied by a decaying liquidity ratio historically precedes sharp corrections.
The Anatomy of an Illiquid De-pegging or Cascade
When external market shocks occur, participants rush to convert volatile assets back into stable or blue-chip base assets (like USDC or ETH). In a token pool characterized by a low liquidity to market cap ratio, the exit path is narrow.
As the first wave of sellers exits, the asset price drops significantly due to high slippage. This drop triggers panic among remaining holders. Because the pool lacks the depth to absorb sustained selling, the price declines at an accelerating rate compared to deeper market pairs.
Conclusion: Balancing Risk and Depth in DeFi Trading
The liquidity to market cap ratio serves as an essential health check for decentralized market participants. High market capitalizations can create an illusion of stability, but without proportional liquidity pool backing, those valuations remain fragile. By integrating strict on-chain audits via DEXTools—specifically analyzing pool depth, tracking volume consistency, and identifying wallet concentrations—traders can effectively distinguish robust ecosystem growth from high-risk, illiquid structures. Ultimately, managing risk in DeFi depends on prioritizing actual capital depth over theoretical token valuations.
The Market Cap Mirage: Why Token Valuation Means Little Without DepthFake Market Cap vs Real Exit Liquidity: Why the Number Can Mislead Traders
The Liquidity Decay Curve: How Token Markets Lose Depth Before They Lose Price
Exit Liquidity Mapping: Who Might Sell Into You Before You Buy?
Disclaimer: This article is for informational purposes only and does not constitute investment advice, financial advice, trading advice, or any other kind of advice. DEXTools does not recommend buying, selling, or holding any cryptocurrency or token. Users should conduct their own research and consult with a qualified financial advisor before making any investment decisions. Cryptocurrency investments are volatile and high-risk. DEXTools is not responsible for any losses incurred.