Realized Price: On-Chain Cost Basis

Traditional charts only show what the last person paid. Discover how Realized Price unmasks the average on-chain cost basis to find true macro support.
Realized Price Explained: Average On-Chain Cost Basis as Support
- Traditional financial charts only tell you a fraction of the macroeconomic story. When you look at a standard spot price ticker, you are viewing the value agreed upon by the last two entities who executed a trade. While this data is perfect for tracking short-term momentum, it completely hides the internal financial health of the broader network. It fails to answer the most critical question in asset allocation: What did the market actually pay for its holdings?
- In public ledger ecosystems, you do not have to guess. Because every asset movement writes an immutable, timestamped record directly to the blockchain, data analysts can trace the exact economic reality of the network.
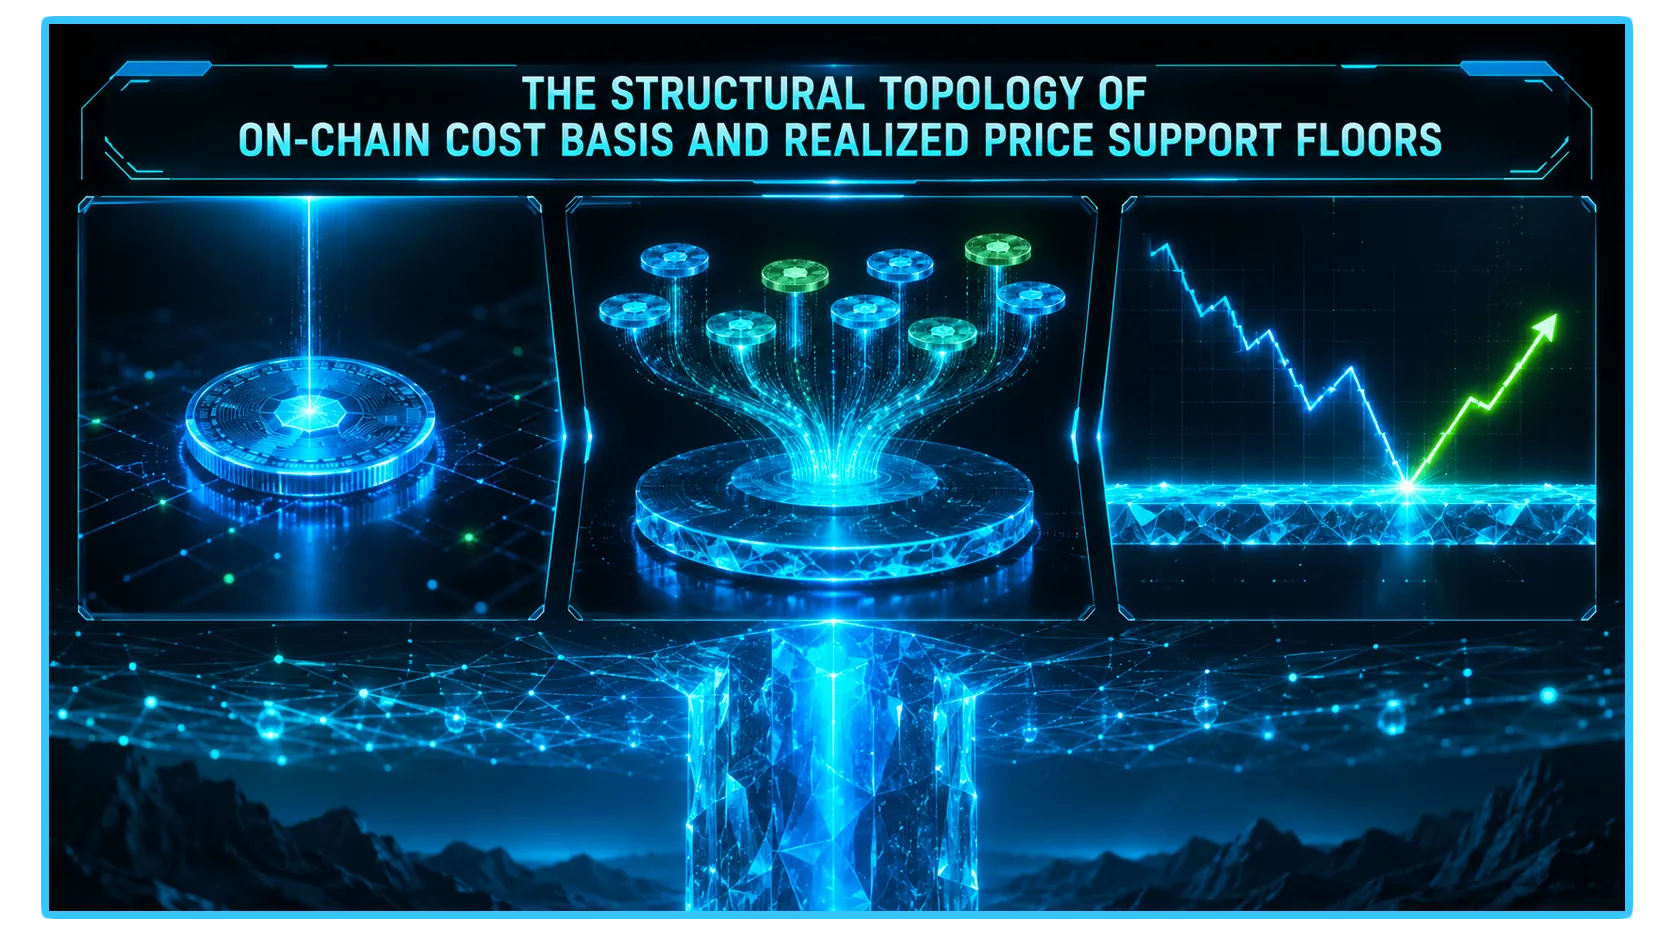
- At the absolute center of this structural analysis sits the Realized Price. Representing the aggregate on-chain cost basis of the entire network, this foundational metric acts as a psychological line in the sand, functioning as an ironclad macroeconomic support floor during deep cyclical corrections.
1. The Core Concept: Unmasking the Aggregate Cost Basis
- To evaluate Realized Price like an experienced network analyst, you must contrast it with traditional Market Price. Market capitalization assumes that every single token in circulation is worth the price of the last token sold. If a whale buys a token for a high price, standard market cap instantly values millions of long-dormant, early-generation tokens at that exact premium, creating a synthetic illusion of paper wealth.
Realized Price completely discards this illusion by calculating the value of the network based on the last time each coin actually moved on-chain.
- When a token is transferred from one wallet to another, the blockchain stamps that transaction with a precise time and price. The protocol records that specific value as the asset's active cost basis. The metric is calculated by taking the aggregate sum of all coins valued at their individual last-movement prices and dividing that total value by the current circulating supply of the asset. This delivers a look-through calculation of the average entry price for the entire investor base.
2. The Psychology of the Realized Price Support Floor
- The structural significance of this metric becomes clear when you observe how market participants react as the spot price approaches the network's average cost basis. The Realized Price establishes three definitive psychological regimes across the cycle:
- During an extended bear market or a deep cyclical correction, panic-selling drives the market spot price downward. When the spot price declines to meet the Realized Price line, the entire network arrives at a collective break-even equilibrium.
- At this point, the average investor is sitting at zero profit. Selling below this line means locking in an absolute financial loss. This triggers a powerful behavioral shift: high-conviction holders refuse to sell their positions, while savvy long-term buyers step in to absorb the remaining supply at what they perceive to be ultimate value. This convergence of seller exhaustion and heavy institutional bidding routinely converts the Realized Price into a generational macro support floor.
3. The Diagnostic Grid: Segmenting Cohort Cost Baselines
To maintain a clean, scannable overview of how on-chain cost basis separates into distinct investor groups, evaluate the operational parameters organized inside this optimized layout:
| Investor Cohort Cost Basis | Primary Market Behavior & Implication |
| Short-Term Holder (STH) Realized Price | Tracks coins moved within the last 155 days; acts as a hyper-sensitive gauge of immediate market sentiment and local support. |
| Long-Term Holder (LTH) Realized Price | Tracks coins dormant for over 155 days; represents the cost basis of market veterans and acts as the ultimate cyclical floor. |
4. Cyclical Transitions: Realized Capitulation Events
- While Realized Price serves as structural support during major bull market pullbacks, deep macro bear markets occasionally witness intense capitulation events where the spot price crashes completely beneath the aggregate cost basis line.
When the spot price resides below the Realized Price, the network enters a state of chronic financial distress. The average participant is holding an open, unrealized loss.
- Historically, these regimes are unsustainable over long timelines. They create severe miner and retail capitulation, forcing weak hands to surrender their assets to high-conviction accumulators. These sub-realized zones have historically signaled the absolute bottom of every major multi-year cycle, representing periods of maximum long-term asymmetric upside.
5. Real-Time Telemetry and On-Chain Execution via DEXTools
- Using indicators like the overall and cohort-specific Realized Prices allows asset allocators to determine exactly where the broader crypto economy stands within multi-year market cycles. However, understanding macro cost basis is only half the battle; executing tactical portfolio maneuvers safely requires continuous access to live, forward-looking market analytics.
- If you attempt to adjust your positions or enter deep liquidity allocations based purely on lagging on-chain metrics without checking active order book thickness and capital flow velocities first, your trades can be severely degraded by wide execution spreads and high slippage.
- DEXTools provides the critical analytical data infrastructure needed to perform these diagnostic verifications in real-time. By utilizing advanced multi-chain pair trackers, live transaction logs, and look-through wallet telemetry across alternative layer scaling networks, market participants can instantly verify the structural health of any asset pool.
- Cross-referencing your macro supply-side insights with authentic blockchain metrics like pool depth and volume velocity ensures your portfolio parameters remain completely optimized, keeping your digital wealth securely protected from unexpected market contractions or sudden liquidity contractions.
You can access DEXTools here and start trading today!
Short-Term Holder Realized Price: On-Chain Guide Realized Cap vs Market Cap: Advanced On-Chain Guide Bitcoin's Realized Price Signals a Possible Bottom Crypto Cost Basis method: FIFO vs. Specific ID
Disclaimer: This article is for informational purposes only and does not constitute investment advice, financial advice, trading advice, or any other kind of advice. DEXTools does not recommend buying, selling, or holding any cryptocurrency or token. Users should conduct their own research and consult with a qualified financial advisor before making any investment decisions. Cryptocurrency investments are volatile and high-risk. DEXTools is not responsible for any losses incurred.