Token Unlock Calendar: How to Use It in Your Trading

Candlestick charts present an illusion of constant supply that traps undisciplined spot buyers. We break down the structural liquidity metrics, float-to-FDV imbalances, and market maker data parameters needed to exploit upcoming token unlock cycles safely.
The Hidden Waterfall: Navigating Supply Dilution in Digital Assets
- In globalized decentralized networks, the nominal price of a token represents a temporary point of agreement between aggressive market demand and liquid market supply. Because digital assets trade continuously across borderless execution venues, retail participants frequently fall into the trap of analyzing candlestick charts as if the underlying token supply were a permanent, unmoving metric. This visual limitation creates a severe structural blind spot. A token can display a highly technical, seemingly bullish consolidation pattern on its daily chart, while a massive, multi-million dollar insider supply expansion sits quietly on the immediate horizon, prepared to flood secondary market order books.
- Unlike traditional equity markets where corporate dilution requires complex regulatory filings, shareholder proxy votes, and extended underwriting windows, cryptocurrency supply structures are dictated entirely by immutable code. Every decentralized protocol launches with a hardcoded monetary policy that specifies exactly how, when, and to whom new tokens will be distributed. When early venture capital allocations, team incentives, or ecosystem rewards break free from their locked smart contracts, a major market transition occurs. This influx of fresh, highly liquid supply can rapidly overwhelm localized market makers, resulting in violent downward price adjustments.
- To protect your capital from these predictable supply shocks and convert institutional dilution into a systematic trading edge, smart allocators look past simple candlestick charts, relying instead on sophisticated token unlock calendar data tracking to chart the exact moments supply expansions drop into active markets. By shifting from a reactive trading style to a proactive approach, you can trace hidden supply waterfalls, calculate precise sell pressure ratios, and coordinate your portfolio entries and short-term hedges alongside institutional capital cycles.
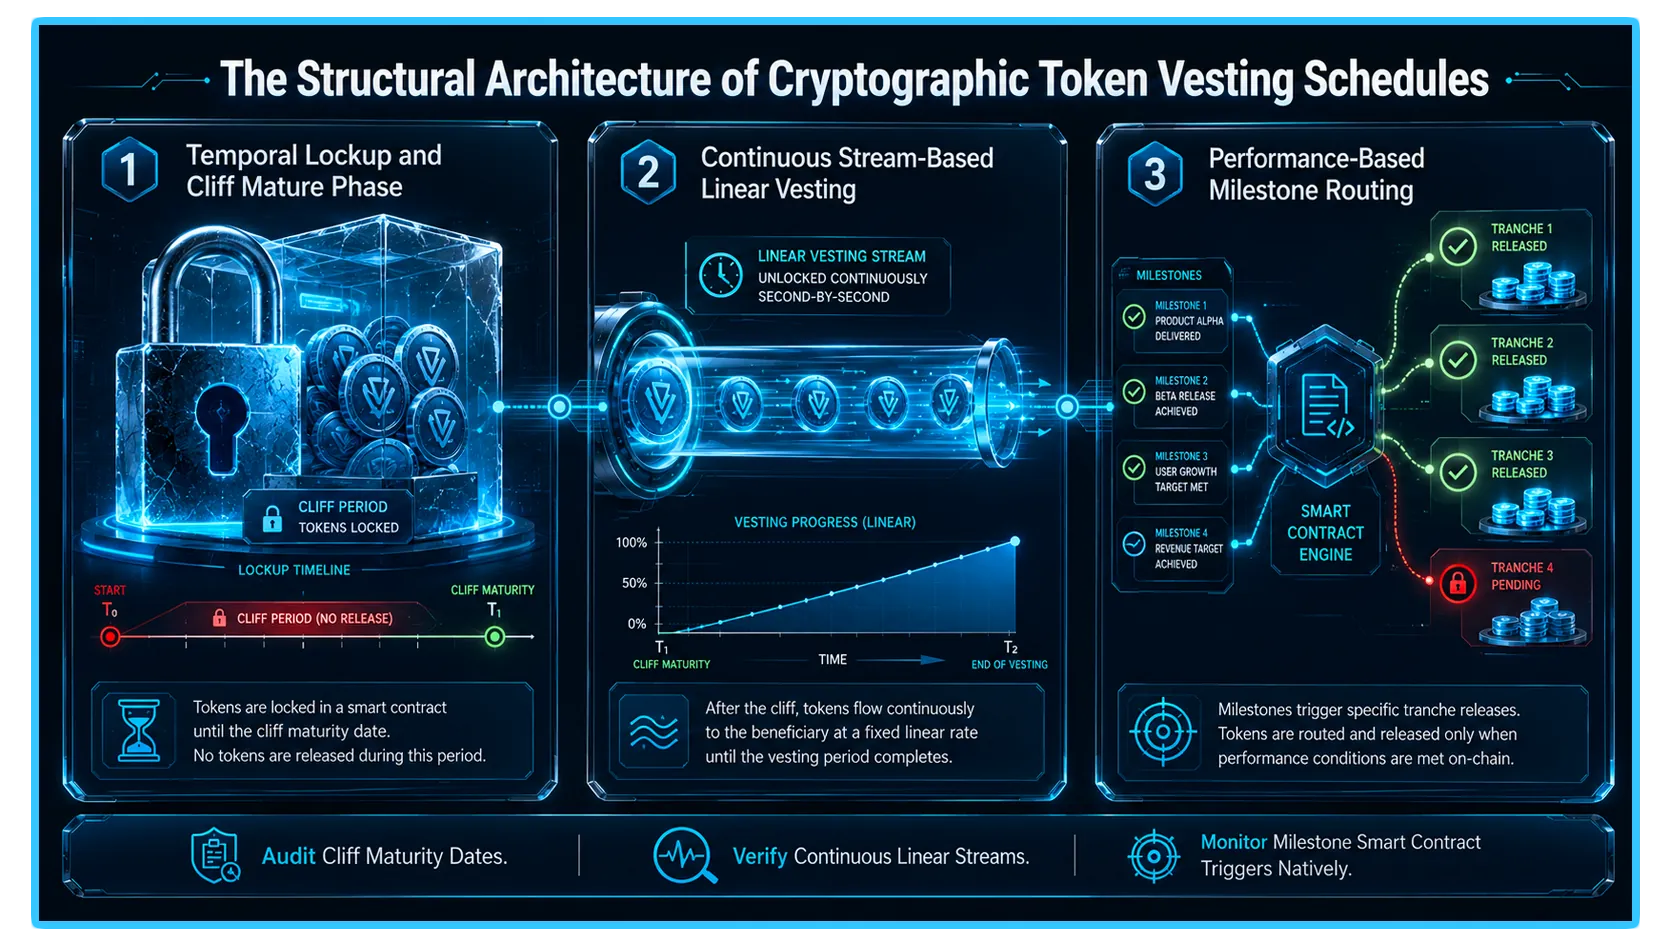
1. The Digital Registry: Demystifying On-Chain Vesting Trackers
- To trade upcoming supply expansions with a genuine statistical edge, you must move past generalized social media rumors and understand how automated tracking dashboards source their data. On-chain vesting trackers do not guess when supply expands; they read the programmatic architectures hardcoded directly into the protocol's master smart contracts.
- When a digital asset is initialized at its token generation event, its master ledger allocates specific portions of the total supply cap to alternative lockup vaults. These repositories are programmed to hold tokens hostage until specific chronological conditions or block-height milestones are fully satisfied. Advanced tracking databases continuously crawl these public smart contract addresses, extracting data to populate public calendars.
When auditing an asset's supply horizon via a dashboard, you must isolate three primary dataset fields:
The Pending Unlock Horizon: The exact countdown timer or block-height projection showing when the next block of locked tokens will be released to participants.
The Distribution Allocation Breakdown: A detailed catalog showing exactly who is receiving the incoming tokens. An unlock distributed entirely to community staking rewards has a completely different market impact than an unlock routed straight to early-stage seed-round venture capitalists.
The Unlock Magnitude: The absolute quantity of tokens entering circulation, evaluated both as a nominal dollar value and as a percentage of the asset's active circulating supply.
By cross-referencing these automated trackers, you transform the abstract concept of token inflation into a concrete, highly scannable timeline, giving you the power to anticipate high-volatility events weeks before they manifest across secondary market exchanges.
2. Quantifying the Shockwave: The Structural Mechanics of Sell Pressure Analysis
- The most common analytical error made by retail participants is assuming that every single token unlock event will automatically cause the asset's spot price to crash. This simplistic view ignores the fundamental mechanics of market microstructure and institutional behavior. To execute a sophisticated sell pressure analysis, you must evaluate the incoming supply shock wave against three specific liquidity parameters.
The Float-to-FDV Imbalance Ratio
- The first defensive layer of your analysis requires evaluating the spatial gap separating the asset's circulating market cap (the float) from its Fully Diluted Valuation (FDV). If a project trades with a low circulating float (e.g., only ten percent of the total cap is active) and an outsized fully diluted valuation, the upcoming unlock represents a critical structural hurdle.
- The closer an asset sits to its initial launch phase, the more aggressive the inflation velocity will be. A token entering a cycle where its circulating supply expands by a massive margin within a single week faces intense structural headwinds, requiring an immense, sustained influx of fresh buying capital simply to prevent the spot price from drifting downward.
The Order Book Depth Validation
- An unlock magnitude evaluated in isolation tells you very little. To understand its true market impact, you must compare the nominal dollar value of the incoming supply directly with the live order book depth of the asset across all major centralized and decentralized exchanges.
- If a tracker warns that twenty million dollars worth of insider tokens are unlocking in forty-eight hours, look at the asset's depth charts. If the cumulative resting buy bids positioned within a tight two percent margin of the active spot price only total two million dollars, the order book is profoundly fragile. If the unlocking participants market-sell even a small fraction of their newly liquid holdings, their aggressive taker orders will instantly slice through the thin resting liquidity, triggering a severe downward price cascade.
The Daily Volume to Unlock Size Velocity
- The final metric to integrate into your analysis is the velocity ratio between the incoming unlock size and the asset's true, organic daily trading volume. If an upcoming unlock represents less than five percent of the authentic daily trading volume, the secondary market can easily absorb the transaction flow with minimal structural friction.
- However, if the unlock size represents several hundred percent of the average daily volume, the asset faces an extreme liquidity block. In this scenario, market makers will naturally drop their bid walls lower, preparing to capture the expected supply expansion at a deep discount.
3. The Corporate Playbook: Analyzing Participant Behaviors
When performing advanced market analysis, integrating token unlock calendar data tracking allows quant desks to overlay supply injection dates with historical order book depth to spot precise breakdown zones. This mapping requires you to decode the distinct financial motives of the different participants receiving the tokens. Not all allocation buckets share the same structural willingness to sell.
Venture Capital and Seed Investors
- Venture capital funds and early seed-round institutional backers operate under strict fund lifecycles. These entities typically invest in a protocol years before its public launch at a microscopic fractional valuation. By the time the public initial exchange listing completes, the venture fund is often up thousands of percent on paper relative to their initial cost basis.
- Because fund managers face an fiduciary obligation to secure actual, realized distributions for their limited partners, their structural bias when a major cliff unlock matures is skewed heavily toward profit realization. Even if a fund remains deeply optimistic about the project's long-term multi-year roadmap, they will routinely liquidate a significant portion of their newly matured tokens to de-risk their initial capital outlay, creating an intense wave of structural sell pressure.
Core Team and Founders
- Founding engineers and core protocol developers are typically granted large allocation blocks to align their long-term incentives with network development. While team unlocks are heavily scrutinized by the community, developers rarely dump their entire liquid allocation onto the public market immediately upon maturity.
- Doing so would trigger intense public panic, damage the project's reputation, and degrade the value of their remaining locked holdings. Team liquidations are typically executed slowly, utilizing algorithmic OTC desks or programmatic sales plans spread over multi-month horizons to minimize visible impact on the candlestick chart.
Ecosystem and Community Rewards
- Tokens unlocked and routed into community rewards, staking incentives, or decentralized treasury grants display a highly fragmented distribution pattern. Community participants who receive fractional rewards for securing the network often treat those tokens as organic cash flow income.
- Rather than holding the asset long-term, these participants display a consistent tendency to continuously claim and market-sell their rewards to compound alternative base assets, introducing a slow, grinding overhead supply headwind that depresses local price ceilings over time.
4. Token unlock calendar: advanced Tactical Setups
Once you can accurately calculate an asset's structural sell pressure and decode participant behaviors, you can deploy distinct tactical execution strategies designed to exploit the token unlock calendar cleanly.
The Pre-Unlock Front-Running Short
The most reliable short-term trading setup manifests days before a major, high-magnitude cliff unlock officially executes. Because token unlock calendars are fully public and visible to all institutional desks, the market naturally builds a bearish consensus as a massive unlock approaches.
The Execution: Short-term momentum desks will build structural short positions seven to ten days ahead of the unlock date, anticipating the incoming supply. This proactive selling causes the asset's price to drift steadily lower ahead of the event.
The Counter-Intuitive Twist: The exact day the unlock completes, the asset's price will frequently execute an immediate, sharp upward counter-trend bounce. This occurs because the short sellers utilize the incoming wave of liquid unlock supply to cleanly cover and close out their short positions without causing slippage against themselves. This behavior triggers a classic "sell the rumor, buy the news" mean-reversion rally.
The Structural Re-Accumulation Wait
For long-term spot allocators looking to build a significant position in a high-conviction protocol, the master token unlock calendar functions as an elite patience guide. Buying a low-float asset right before its primary institutional cliff unlock matures is an operational error that exposes your portfolio to immediate downside capital risk.
The Execution: The disciplined strategy demands standing completely aside throughout the initial months of the token's listing history. Wait for the asset to clear its major venture capital cliff unlocks, allowing secondary market order books to fully ingest and process the insider distribution wave.
The Accumulation Trigger: Once the asset's Cumulative Volume Delta stabilizes on expanding volume after a major unlock event, it proves that institutional buyers have stepped in to absorb the distribution. This structural stabilization marks a high-probability, de-risked zone to initialize long-term spot re-accumulation positions at a major structural discount.
Unlock Strategy Reference Parameters
| Metric Dimension | Low Structural Risk Configuration | High Structural Risk Configuration |
| Unlock Size vs. Circulating Float | Represents less than 2% of active float | Exceeds 15% of active circulating float |
| Order Book Bid Depth Ratio | Resting bids easily absorb the unlock value | Unlock value dwarfs available bid depth |
| Recipient Allocation Profile | Community rewards & ecosystem reserves | Early-stage seed venture capital funds |
| True Daily Trading Volume Ratio | Unlock represents a fraction of daily volume | Unlock size represents multi-day trading volume |
5. Integrating Telemetry Auditing via DEXTools
Even when keeping your private keys safe offline with robust cold storage backups, maintaining visibility over the decentralized landscape remains vital. DEXTools delivers real-time analytics to track token dynamics, smart contract configurations, and pool activities across alternative blockchains.
By leveraging diagnostics like the Pair Explorer, Live New Pairs tracker, Big Swap Explorer, and Top Traders boards, participants can seamlessly analyze transactional volumes, monitor large whale reallocations, and run automated contract audits before executing on-chain swaps. This ensures your hardened cryptographic setup interacts exclusively with legitimate, highly liquid trading venues while your foundational assets rest fully protected.
You can access DEXTools here and start trading today!
Token Vesting Schedules: How to Read a Cliff & Linear UnlockCliff Unlock vs Linear Vesting: Sell PressureTop 5 Token Unlock Trackers 2026How to Read Token Unlocks Before Buying in 2026
Disclaimer: This article is for informational purposes only and does not constitute investment advice, financial advice, trading advice, or any other kind of advice. DEXTools does not recommend buying, selling, or holding any cryptocurrency or token. Users should conduct their own research and consult with a qualified financial advisor before making any investment decisions. Cryptocurrency investments are volatile and high-risk. DEXTools is not responsible for any losses incurred.