Volume Profile Explained: How Pros Read Liquidity

Time-based volume bars leave traders blind to price-specific liquidity. We break down the horizontal histograms and auction market theories needed to map institutional fair-value zones safely.
The Dimensional Blind Spot: Shifting from Time to Price
- In globalized digital asset networks, transaction volume serves as the absolute, un-falsifiable metric of market conviction. While candlestick patterns can be easily spoofed on thin order books and technical indicators can generate lagging calculations during volatile market regimes, raw execution data does not lie. It reveals the exact footprints of institutional capital, algorithmic market makers, and retail distributions. However, the vast majority of retail market participants process this vital dataset through a severe dimensional blind spot: they rely exclusively on standard, time-based vertical volume bars.
- Traditional volume indicators sit quietly at the bottom of the chart, mapping how many tokens changed hands within a specific block of time, such as a 1-hour or 1-day candle. This configuration tells you when a transaction occurred, but it completely ignores at what price that capital was deployed. A vertical volume bar cannot tell you if millions of dollars were swapped at the absolute peak of a breakout or quietly accumulated at a structural support floor. It compresses all transaction metadata into a single vertical coordinate.
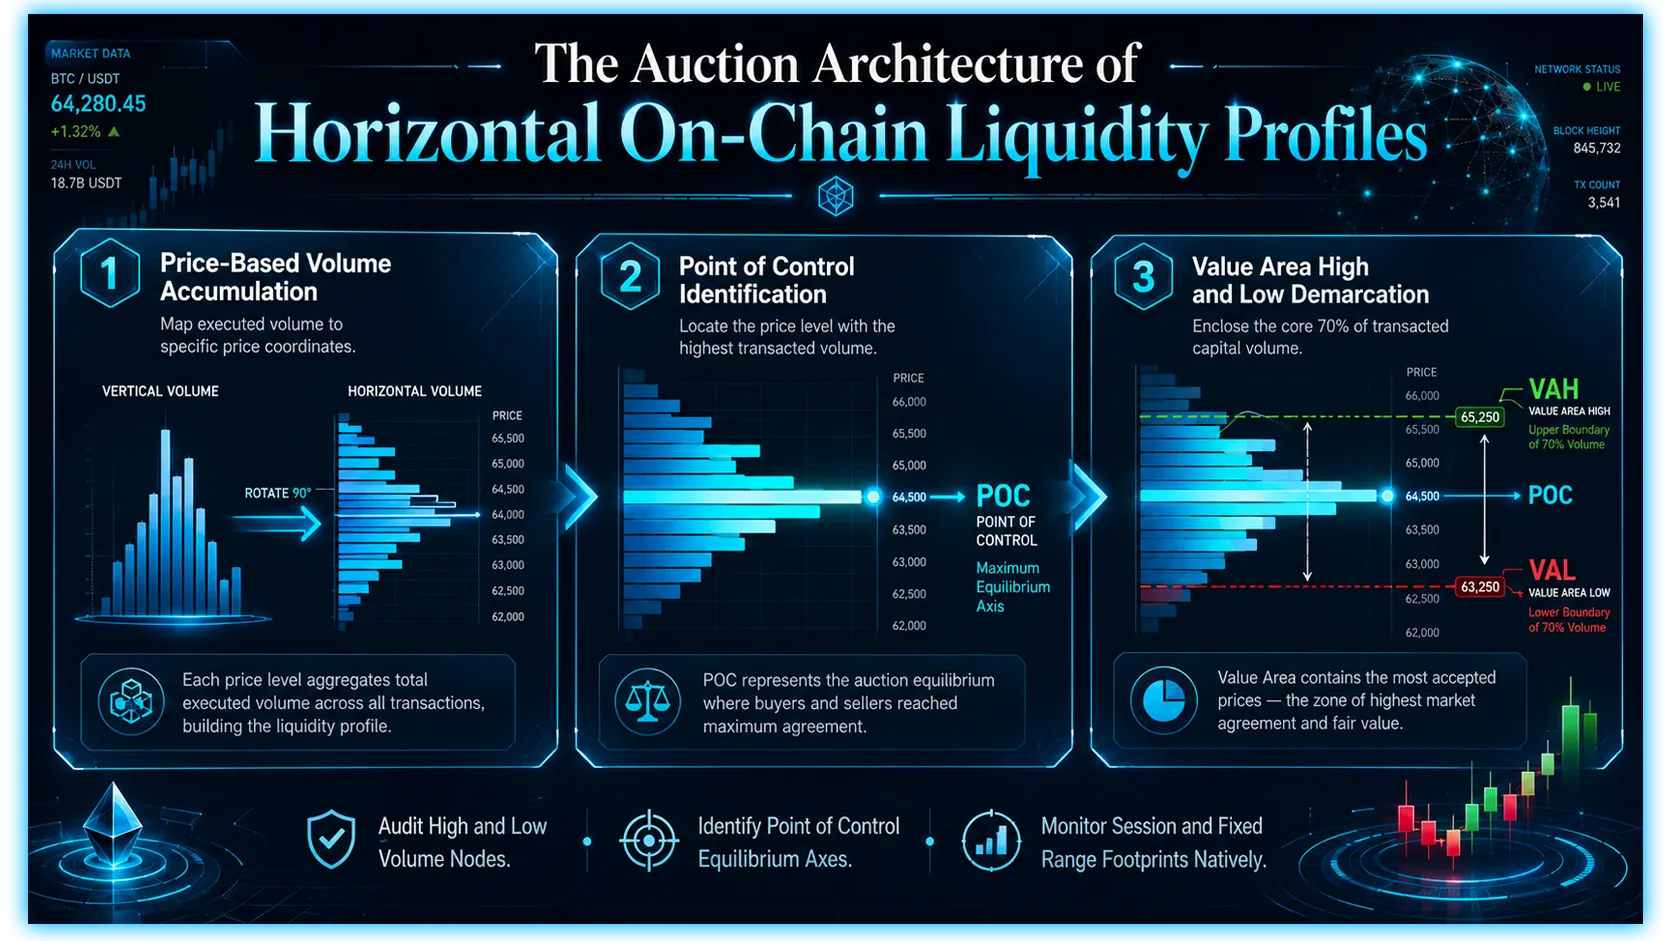
- To eliminate this data friction, professional institutional trading desks invert their perspective. They utilize the Volume Profile. Operating as an advanced data-visualization framework, the Volume Profile shifts volume data from the horizontal time axis to the vertical price axis. It builds a detailed horizontal histogram across the side of the chart, revealing the exact cumulative volume executed at specific price coordinates.
- By analyzing the market through this price-based methodology, you transition from simple trend-following guessing games to a deep understanding of Auction Market Theory. The chart is no longer just a sequence of random wiggles; it transforms into a highly structured map of active liquidity nodes, institutional fair-value zones, and hidden order book vacuums. Understanding this structural architecture is the ultimate prerequisite to trading alongside the smart money.
1. The Core Anatomy: Mastering POC, VAH, and VAL Boundaries
To navigate a Volume Profile histogram with absolute strategic clarity, you must learn to read its structural anatomy. The profile is not a uniform block of data; it structures itself into distinct geographical boundaries that represent varying degrees of market consensus.
The Point of Control (POC)
- The Point of Control represents the absolute horizontal axis of the profile. It is the single price line where the highest concentration of trading volume was executed throughout the selected lookback horizon. In Auction Market Theory, the POC marks the definitive Fair Value zone of an asset. It is the exact coordinate where buyers and sellers found maximum structural agreement, making it a powerful psychological anchor point.
- When price trends away from the POC on thin volume, the market enters an inefficient, unfair state, establishing a continuous macroeconomic pull that seeks to drag the spot price back toward this heavy liquidity center.
The Value Area High (VAH) and Value Area Low (VAL)
The market does not interact exclusively at a single price line; it auctions continuously across a broader range of relative acceptance. The Value Area (VA) defines the core horizontal channel where exactly 70% of the total trading volume occurred within the selected profile window. This 70% boundary is chosen because it lines up with the first standard deviation under a classical statistical bell curve distribution.
Value Area High (VAH): The upper boundary wall of this core value distribution zone. It marks the highest price ceiling where participants were still willing to accept a high volume of peer-to-peer transactions.
Value Area Low (VAL): The lower boundary floor of the value distribution zone, marking the deepest price discount where high-volume transactional agreement materialized.
2. Structural Microstructures: High Volume Nodes vs. Low Volume Nodes
As you examine the variable peaks and valleys of a horizontal Volume Profile histogram, the structural layout splits into two distinct structural microstructures that dictate exactly how price action will behave when it enters those specific price zones.
High Volume Nodes (HVNs): The Market Trampolines
High Volume Nodes are the prominent horizontal peaks that jut outward from the profile graph. They represent price channels where the asset spent an extended period consolidating sideways, generating massive capital turnover.
The Institutional Handshake: HVNs prove that the market has collectively accepted that specific price zone as a fair, balanced trading arena.
The Price Action Response: Because an immense volume of limit orders is continuously nested inside an HVN, it acts as a massive cushion or trampoline. When an asset pulls back down into an established High Volume Node, the dense block of historical order flow absorbs incoming sell pressure seamlessly, converting the peak into a highly reliable structural support floor.
Low Volume Nodes (LVNs): The Liquidity Vacuums
Conversely, Low Volume Nodes are the deep valleys or hollow indentations where the histogram bars collapse inward toward the chart margin. LVNs mark price channels where the asset auctioned with extreme velocity, slicing through the territory within a matter of minutes or seconds.
The Unfair Pricing Void: LVNs represent zones of severe structural imbalance. They prove that neither buyers nor sellers were willing to establish consensus at those specific coordinates, leaving the zone completely devoid of historical limit orders.
The Price Action Response: Because an LVN contains virtually zero order book depth, it behaves as a literal liquidity vacuum. When an asset's spot price breaks out into an established Low Volume Node, it encounters no structural friction or historical buy/sell walls. The price will instantly accelerate, flying straight through the LVN valley in a single vertical flash wick until it hits the next major High Volume Node peak on the other side.
3. Typologies: Session vs. Fixed Range vs. Visible Range
Professional allocators do not simply load a single default profile overlay and leave it un-adjusted. They deploy three distinct variations of the tool, tailoring the lookback parameters to match their specific execution horizons.
Session Volume Profile (SVP)
The Session Volume Profile isolates price-based volume distribution across a single, standardized trading session (such as a 24-hour daily crypto cycle). SVP grids stack sequentially along the timeline chart:
The Value Shift Tracking: SVP allows intraday traders to track how fair value migrates day over day. If today's developing POC forms significantly higher than yesterday's closed POC, it confirms an authentic, institutional bull trend continuation.
The Daily Bracket Strategy: Intraday scalping bots continuously target entries at the current session's VAL and exit targets at the VAH, exploiting the daily mean-reversion loops of the market.
Fixed Range Volume Profile (FRVP)
The Fixed Range Volume Profile is a highly tactical tool that allows the operator to manually select a customized structural block across the timeline. You manually click an anchor point at the exact origin of a market trend (such as a major macro cycle bottom) and stretch the selection box forward to end at a specific peak.
Isolating the Impulse Wave: FRVP ignores all external market noise, displaying exclusively how capital was distributed inside that single chosen wave. This optimization reveals precisely where the institutional market makers parked their primary liquidity blocks during the initial breakout drive.
Visible Range Volume Profile (VRVP)
The Visible Range Volume Profile acts as the ultimate macroeconomic master map. It automatically calculates and displays the volume distribution for whatever data happens to be actively visible on your terminal screen. As you zoom out to capture multi-month timelines, the VRVP adjusts its horizontal bars dynamically, mapping out the multi-year support ceilings and ultimate liquidation floors of the entire asset lifecycle.
Volume Profile Structural Components
| Component Name | Technical Core Parameters | Operational Market Role |
| Point of Control (POC) | Single highest volume price coordinate | Represents absolute institutional fair value |
| Value Area (VA) | Encloses exactly 70% of total session volume | Defines the accepted trading arena bounds |
| High Volume Node (HVN) | Significant horizontal histogram peaks | Acts as structural support / resistance cushions |
| Low Volume Node (LVN) | Drastic horizontal histogram valleys | Functions as frictionless liquidity vacuums |
Execution Frameworks
| Typology Track | Anchor Parameters | Primary Tactical Utility |
| Session Profile (SVP) | Fixed 24-Hour Daily Block | Intraday Scalping & Value Migration Analysis |
| Fixed Range (FRVP) | Manual Point-to-Point Selection | Isolating Specific Accumulation/Distribution Legs |
| Visible Range (VRVP) | Dynamic Terminal Screen Window | Macro Trend Mapping & Key Cycle Boundary Sourcing |
4. Advanced Tactical Setups: Trading the Auction Cycles
To execute strategies using the Volume Profile with institutional precision, you must understand the underlying cycle of Auction Market Theory: Markets continuously shift from balance to imbalance, then back to balance.
The Value Area Rejection (Mean Reversion setup)
When an asset is locked inside a structural horizontal ranging channel, it spends its time bouncing between the Value Area High and the Value Area Low boundaries of the profile.
The Execution Playbook: As the spot price drifts upward to test the VAH ceiling on thin volume, it signals that the market is rejecting higher prices as unfair value. Pros enter short positions or scale out of spot capital at this border, setting an automated take-profit target straight back down at the central Point of Control (POC) line. Symmetrically, a dip down into the VAL floor provides a high-probability mean-reversion buying opportunity targeting the POC axis.
The Volume Gap Breakout (Trend Continuation setup)
The highest-velocity trading setups manifest when an asset breaks completely clear of its core Value Area boundaries on massive, expanding vertical volume.
The Execution Playbook: If a token prints a definitive candle close completely above the established VAH line, it confirms that the market has officially shifted from a balanced state to an aggressive, trended imbalance state. The moment the price clears the VAH barrier, it steps directly into a Low Volume Node gap.
The Target Definition: Because there are no historical order blocks inside an LVN to slow down price velocity, traders enter high-conviction breakout momentum trades the exact millisecond the VAH cracks. They ride the vertical acceleration wick through the profile valley, setting a precise profit-taking target at the absolute pixel-line of the next major overhead High Volume Node peak.
5. Integrating Telemetry Auditing via DEXTools
Even when keeping your private keys safe offline with robust cold storage backups, maintaining visibility over the decentralized landscape remains vital. DEXTools delivers real-time analytics to track token dynamics, smart contract configurations, and pool activities across alternative blockchains. By leveraging diagnostics like the Pair Explorer, Live New Pairs tracker, Big Swap Explorer, and Top Traders boards, participants can seamlessly analyze transactional volumes, monitor large whale reallocations, and run automated contract audits before executing on-chain swaps. This ensures your hardened cryptographic setup interacts exclusively with legitimate, highly liquid trading venues.
You can access DEXTools here and start trading today!
Volume Profile in Crypto Explained: POC, Value Area, HVN and LVN Fake Volume vs Real Demand: How to Spot Artificial Momentum in DeFi Trading Smart Money Wallet Tracking: How to Follow the Pros Whale Buy or Exit Liquidity? How to Read Big Swaps Without Blindly Copying WhalesDisclaimer: This article is for informational purposes only and does not constitute investment advice, financial advice, trading advice, or any other kind of advice. DEXTools does not recommend buying, selling, or holding any cryptocurrency or token. Users should conduct their own research and consult with a qualified financial advisor before making any investment decisions. Cryptocurrency investments are volatile and high-risk. DEXTools is not responsible for any losses incurred.