What Is the ADX Indicator in Crypto Trading? 2026 Guide
— By Tony Rabbit in Tutorials
Learn how the ADX indicator measures trend strength in crypto trading, how to read it with +DI and -DI, and how to use it to filter out choppy markets.
Crypto markets swing between explosive trends and long stretches of sideways chop, and knowing which regime you are in is half the battle. The ADX indicator is one of the most respected tools for answering a single, powerful question: is the market actually trending, or is it just drifting? Rather than telling you which way price is heading, it tells you how much conviction is behind the move.
In this 2026 guide we break down what the ADX indicator is, how it works alongside its companion lines, how to read its values, and how traders use it to avoid getting chopped up in flat ranges. By the end you should understand why so many trend traders treat ADX as a core filter for their setups.
What Is the ADX Indicator?
ADX stands for Average Directional Index. It was developed by J. Welles Wilder, the same technician behind the RSI and the Parabolic SAR, and introduced in his 1978 work on technical trading systems. The ADX measures the strength of a trend, not its direction, on a scale from 0 to 100.
This distinction is the most important thing to internalize. A high ADX reading does not mean price is going up. It simply means that whatever direction price is moving, it is moving with strong momentum. A low reading means the market lacks a clear trend, regardless of whether price is slightly higher or lower than before. Because it ignores direction, ADX pairs naturally with tools that do show direction.
How the ADX Works: +DI and -DI
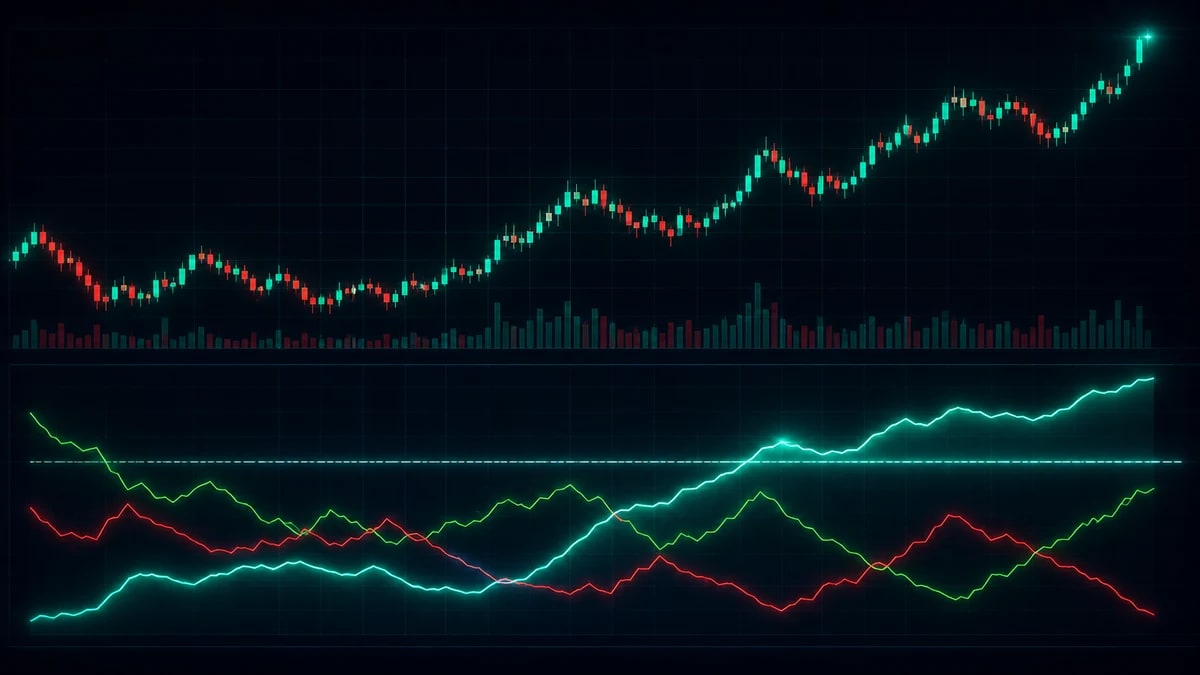
The ADX is usually plotted with two directional indicators that do the directional heavy lifting: +DI (the positive directional indicator) and -DI (the negative directional indicator). These two lines are derived from price movement and are the building blocks that the ADX is calculated from.
The relationship between them is simple to interpret. When +DI is above -DI, buyers are in control and upward pressure dominates. When -DI is above +DI, sellers are in control and downward pressure dominates. The crossovers between these two lines give you the direction of the move, while the ADX line itself tells you the strength behind it.
Putting the Three Lines Together
Think of it as a division of labor. The +DI and -DI lines answer the question of who is winning, buyers or sellers. The ADX answers how decisively they are winning. A +DI crossover above -DI while the ADX is rising is a far more compelling signal than the same crossover happening while ADX sits flat near the bottom of its range.
How to Read ADX Values
A common framework for reading the ADX uses a few key thresholds. A reading above 25 suggests a strong trend is in place. A reading below 20 suggests a weak or ranging market where trend strategies tend to underperform. The zone between 20 and 25 is something of a gray area where a trend may be forming or fading.
Just as important as the absolute value is the slope. A rising ADX means the current trend is strengthening, which is exactly what trend followers want to see. A falling ADX means the trend is weakening, even if price is still grinding in the same direction. Watching whether ADX is climbing or rolling over often gives an earlier read than the raw number alone.
Default Settings
The standard configuration for the ADX is a 14 period, which Wilder used as his default. Many charting platforms apply this automatically. Shorter periods make the indicator more responsive but noisier, while longer periods smooth it out at the cost of speed. For most crypto traders, the 14 period default is a sensible starting point before any tuning.
Using ADX in Crypto Trading
The most practical use of the ADX is as a filter. Trend following strategies, such as riding moving average crossovers or trading breakouts, perform best when a genuine trend exists. By requiring the ADX to be above 25 before taking a trend trade, you screen out a large share of false signals that occur during choppy, directionless conditions.
The reverse is also valuable. When the ADX is low, sitting below 20, it is a signal to be cautious with trend strategies and perhaps to favor range based approaches or to simply stand aside. Many traders lose money not because their entries are bad, but because they apply trend logic to a market that is not trending. ADX helps you avoid that mismatch.
Combining ADX With Other Tools
The ADX is a lagging indicator, meaning it confirms what has already begun rather than predicting what is about to happen. Because of this, it works best when combined with price action, support and resistance levels, or other indicators rather than used in isolation. A breakout above a key level that coincides with a rising ADX carries more weight than a breakout on a flat reading.
When you are scanning decentralized markets, charting platforms like DEXTools let you overlay the ADX alongside price and volume so you can quickly judge whether a token is in a real trend or just bouncing around. Layering trend strength on top of your existing chart context turns a raw number into an actionable read.
Common Mistakes to Avoid
One frequent error is treating a high ADX as a buy signal on its own. Remember that the ADX is directionless, so a high reading during a downtrend simply confirms a strong move lower. Always pair it with the +DI and -DI lines or price structure to know which way to lean.
Another mistake is ignoring the slope and reacting only to the threshold. An ADX that has just crossed above 25 and is still climbing tells a very different story from one that is above 25 but rolling over. Treating those two scenarios identically leads to chasing trends that are already running out of steam.
Traders also tend to over optimize the period setting in search of a perfect number, jumping between values after every losing trade. In practice the 14 period default holds up well across most timeframes and tokens, and constant tweaking usually adds noise rather than edge. It is far more productive to keep the setting stable and focus on how the ADX behaves around your actual support, resistance, and breakout levels. Consistency in how you read the tool matters more than the exact length you feed it.
Conclusion
The ADX indicator is a trend strength gauge, not a direction signal, and that is precisely what makes it so useful. By reading its 0 to 100 scale, watching whether it is rising or falling, and pairing it with the +DI and -DI lines, you gain a clear sense of when the market is trending hard enough to justify trend strategies and when it is too choppy to bother. Use the 14 period default as your baseline, combine the ADX with price action and other tools, and let it filter your setups rather than dictate them outright. This article is educational and is not financial advice; always do your own research before trading.
Related Guides
- What Is the Supertrend Indicator in Crypto Trading? 2026 Guide
- What Is VWAP in Crypto? Complete Indicator Guide 2026
- What Is Wash Trading in Crypto? Beginner Guide (2026)
- Wash Trading in Crypto: Red Flags Explained
- What Is Trading Volume in Crypto? How to Read It (2026)
- What Is the Parabolic SAR Indicator in Crypto Trading? (2026
- What Is Williams %R in Crypto Trading? Indicator Guide (2026
Frequently Asked Questions
What is the ADX indicator?
ADX, or Average Directional Index, is a technical indicator that measures the strength of a trend. It does not show trend direction, only how strong or weak the current trend is.
How do you read the ADX indicator?
ADX values are typically interpreted so that higher readings indicate a stronger trend and lower readings indicate a weak or ranging market. Traders often pair it with the +DI and -DI lines to assess direction.
What are +DI and -DI in ADX?
The +DI and -DI lines measure upward and downward directional movement, respectively. Comparing them helps identify whether buyers or sellers are dominating, while ADX measures the strength of that move.
How is ADX used to filter choppy markets?
Because ADX gauges trend strength, low readings can signal choppy or sideways conditions where trend strategies struggle. Some traders avoid trend trades when ADX is weak and focus on periods of stronger trend.