Metric Double Counting: Why Volume, Transactions and Holders Can Tell the Same Story Twice
— By Whatsertrade in Tutorials
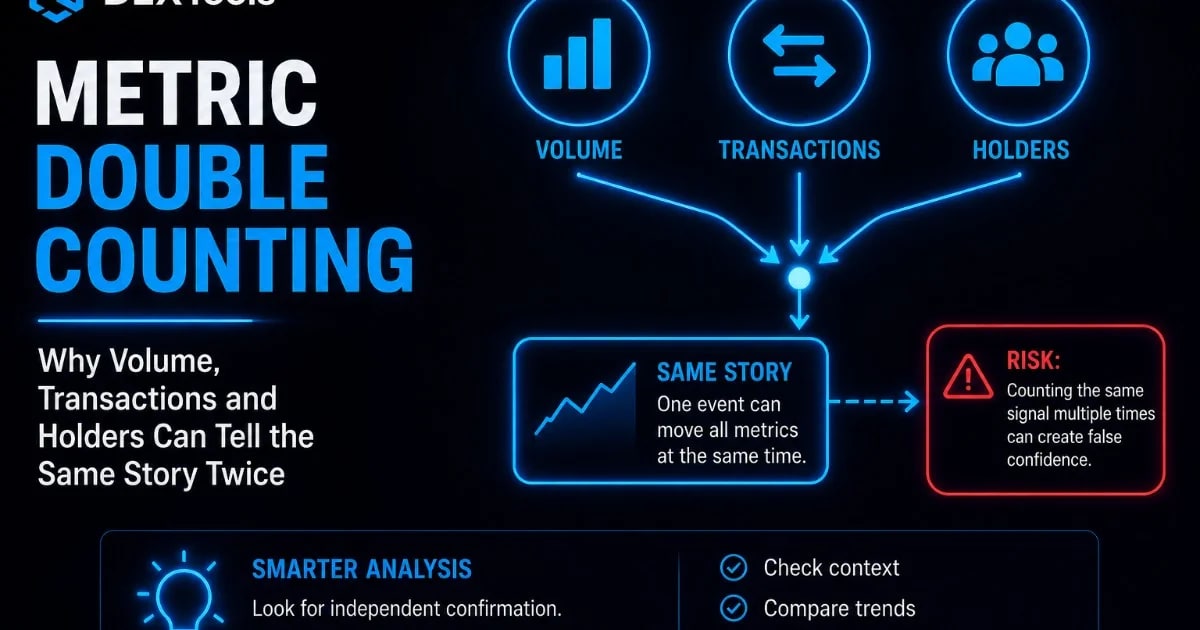
Learn why volume, transactions, and holders can sometimes tell the same story twice on DEXTools, and how to avoid overestimating token strength.
Crypto traders often look for multiple signals before entering a trade. High volume, many transactions, rising holders, and a strong chart can make a token look convincing. But there is a hidden problem: some of these metrics may be telling the same story in different ways.
This is called metric double counting.
Key Takeaways
- Why Double Counting Matters
- Volume and Transactions Are Closely Related
- Holder Growth Can Follow the Same Event
- The Chart Can Reflect the Same Data Too
- How to Find Independent Confirmation
- The Three-Bucket Method
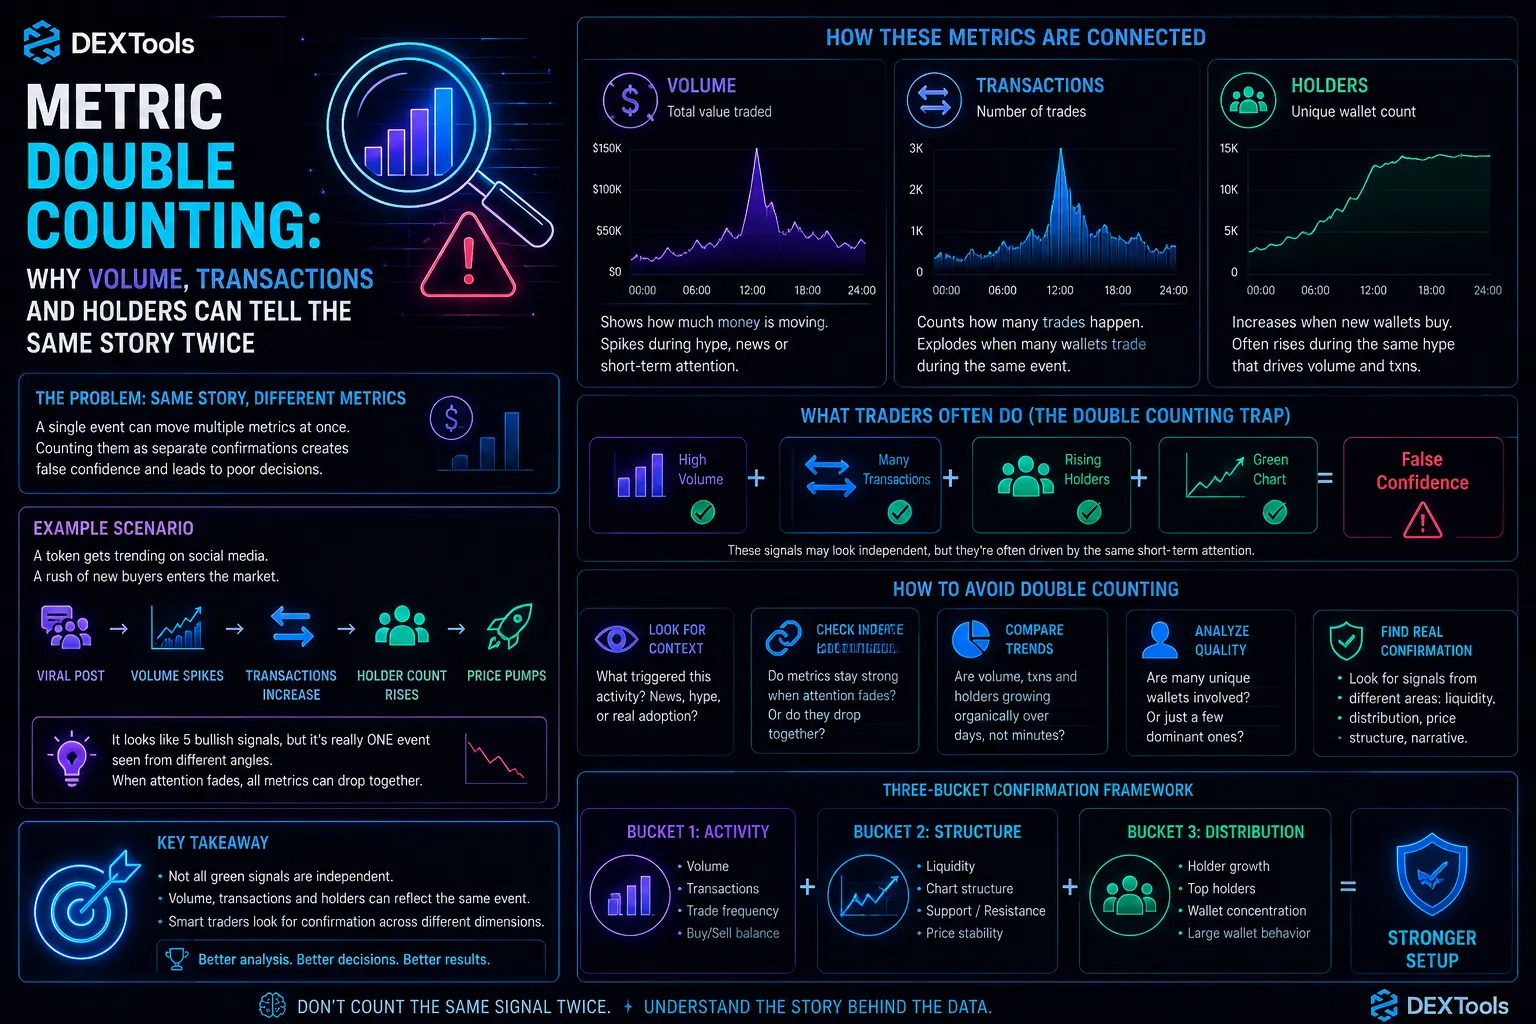
Metric double counting happens when traders treat related signals as separate confirmations. For example, a token with high volume may also have many transactions because both come from the same short burst of trading activity. If holders also rise during that burst, the trader may think there are three independent bullish signals when there may only be one event.
DEXTools gives traders many useful data points. The skill is knowing when those data points are truly independent and when they are connected.
Why Double Counting Matters
Double counting creates false confidence. A trader may believe a setup is stronger than it really is because several metrics appear positive at the same time.
But if those metrics are driven by one source of activity, the setup may not have broad support.
For example:
A marketing post creates a rush of buyers.
Volume rises.
Transactions increase.
Holder count grows.
The chart pumps.
At first glance, this looks like five bullish signals. But they may all come from the same short-term attention spike.
If attention fades, all five signals can weaken together.
Volume and Transactions Are Closely Related
Volume measures the value traded. Transactions measure the number of trades. These two metrics often move together.
If a token has many trades, volume may rise. If a few large trades happen, volume may rise even without many transactions.
When both volume and transactions increase, ask:
Are there many unique wallets?
Are transactions coming from different buyers?
Are trade sizes healthy?
Is activity consistent over time?
Is the volume mostly buying or selling?
Volume plus transactions is useful, but it is not always two separate confirmations. Sometimes it is one activity spike viewed from two angles.
Holder Growth Can Follow the Same Event
Holder growth can also be connected to volume and transactions. When many new buyers enter, holder count increases. That can be positive, but it may not be independent confirmation.
The important question is whether new holders stay, accumulate, or exit quickly.
A stronger signal appears when holder growth continues after the initial volume spike. If holders only rise during the pump and then stop growing, the metric may be less meaningful.
Healthy holder growth should show persistence, not only reaction.
The Chart Can Reflect the Same Data Too
A rising chart is often the result of buying volume, transaction activity, and new holders. If traders count the chart as a separate signal without checking what caused it, they may double count again.
A green chart does not automatically confirm volume. It may simply display the result of that volume.
Instead of asking “Is the chart green?” ask:
Did the chart hold after the initial move?
Was there consolidation?
Did buyers return after pullbacks?
Did volume continue after the first spike?
A chart is more useful when it shows structure over time.
How to Find Independent Confirmation
To avoid double counting, look for signals that come from different parts of the market.
Examples of more independent confirmation include:
Liquidity improving while volume grows.
Holder growth continuing after hype slows.
Buyers defending pullbacks after the first pump.
Large wallets holding while new buyers enter.
Risk indicators remaining clean while market activity expands.
These signals are more valuable because they do not all depend on one moment of attention.
The Three-Bucket Method
A simple way to avoid double counting is to place metrics into three buckets.
Bucket 1: Activity
Volume, transactions, trade frequency, buyer and seller count.
Bucket 2: Structure
Liquidity, chart support, price stability, slippage risk.
Bucket 3: Distribution
Holder growth, top holders, wallet concentration, large wallet behavior.
A stronger setup has signals from all three buckets. A weaker setup may only have strong activity while structure and distribution remain poor.
Example of Weak Confirmation
A token pumps after a viral post. Volume rises, transactions increase, holders grow, and the chart goes vertical.
But liquidity stays thin. Top holders remain concentrated. Sell pressure appears quickly. The chart fails to consolidate.
This is not five strong signals. It is one attention spike with weak support.
Example of Stronger Confirmation
A token shows steady volume, growing unique buyers, increasing liquidity, controlled pullbacks, and gradual holder expansion. Large wallets are not aggressively selling.
Here, the signals come from multiple areas: activity, structure, and distribution.
That is a stronger data story.
Final Thoughts
DEXTools provides many useful metrics, but traders must avoid counting the same event multiple times. Volume, transactions, holders, and chart movement can all reflect one burst of attention.
The goal is to find independent confirmation. Look for alignment across activity, structure, and distribution.
When different types of data support the same idea, the setup becomes more credible. When every metric depends on the same hype event, caution is needed.
Smart analysis is not about seeing more numbers. It is about understanding what those numbers really mean.
Holder Inflation: Why More Wallets Does Not Always Mean More Believers Fake Holders vs Real Buyers: How Wallet Count Can Mislead Traders When Not to Trade: 12 Red Flags Every DeFi Trader Should Know Settlement Volume vs Transfer Count: Which Better Shows Real On Chain Value Movement?