How to Compare Two Tokens in the Same Narrative Using DEXTools
— By Whatsertrade in Tutorials
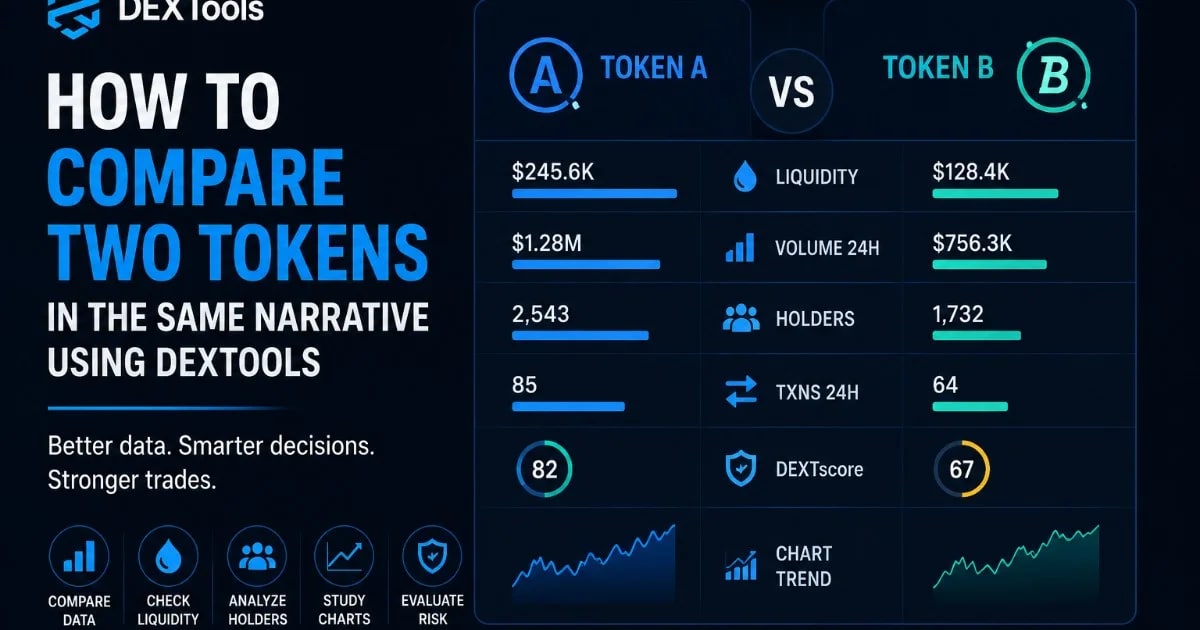
Discover effective strategies for analyzing tokens in the same narrative with DEXTools. Make informed trading decisions based on real market data.
Crypto narratives move fast. One week the market focuses on meme coins. Another week attention shifts to AI tokens, gaming, real world assets, Layer 2 ecosystems, or new chain launches.
When a narrative becomes popular, many tokens begin to move at the same time. Traders then face an important question: which token is actually stronger?
Key Takeaways
- Why Token Comparison Matters
- Step 1: Compare Liquidity
- Step 2: Compare Volume Quality
- Step 3: Compare Chart Structure
- Step 4: Compare Holder Growth
- Step 5: Compare Transaction Behavior
DEXTools can help traders compare tokens inside the same narrative using real market data. Instead of choosing based on hype, logos, or social media noise, traders can compare liquidity, volume, holders, transactions, and chart behavior.
This guide explains how to compare two tokens in the same sector or trend using DEXTools.
Why Token Comparison Matters
Many traders analyze tokens individually. They look at one chart, see green candles, and make a decision. But crypto markets are relative. A token may look strong alone, but weak compared to another token in the same narrative.
For example, two meme coins may both be rising. One may have deeper liquidity, healthier holders, and steady buy pressure. The other may have thin liquidity, concentrated wallets, and unstable volume.
Comparison helps traders identify quality. It also helps avoid choosing the loudest token instead of the strongest one.
Step 1: Compare Liquidity
Liquidity is one of the most important metrics when comparing tokens. A token with stronger liquidity usually offers better trading conditions and lower risk of extreme price impact.
When comparing two tokens, ask:
Which token has deeper liquidity?
Is liquidity stable or changing quickly?
Does liquidity support the current volume?
Has liquidity been added or removed recently?
A token with a smaller market cap but stronger liquidity may sometimes be healthier than a token with a larger pump and weak pool depth.
Liquidity does not guarantee safety, but it is a key part of market quality.
Step 2: Compare Volume Quality
Volume is useful, but only when understood correctly. Higher volume does not always mean a better token.
Compare how volume behaves across both tokens. Is volume increasing naturally over time? Does it come with holder growth? Is it supported by real transactions from different wallets? Or does it appear in sudden spikes without follow through?
A token with consistent volume may be more reliable than a token with one explosive spike followed by silence.
The goal is to identify sustainable activity, not just impressive numbers.
Step 3: Compare Chart Structure
Charts reveal how the market is reacting to each token. When comparing two tokens, do not only ask which one is up more. Ask which chart is healthier.
A healthier chart may show:
Controlled upward movement
Higher lows
Periods of consolidation
Buyers defending pullbacks
Less violent selling after pumps
A weaker chart may show:
Vertical candles followed by sharp dumps
Unstable price action
Repeated failed breakouts
Heavy sell pressure at every high
No clear support levels
The strongest token is not always the one that pumped hardest. Sometimes it is the one that holds gains better.
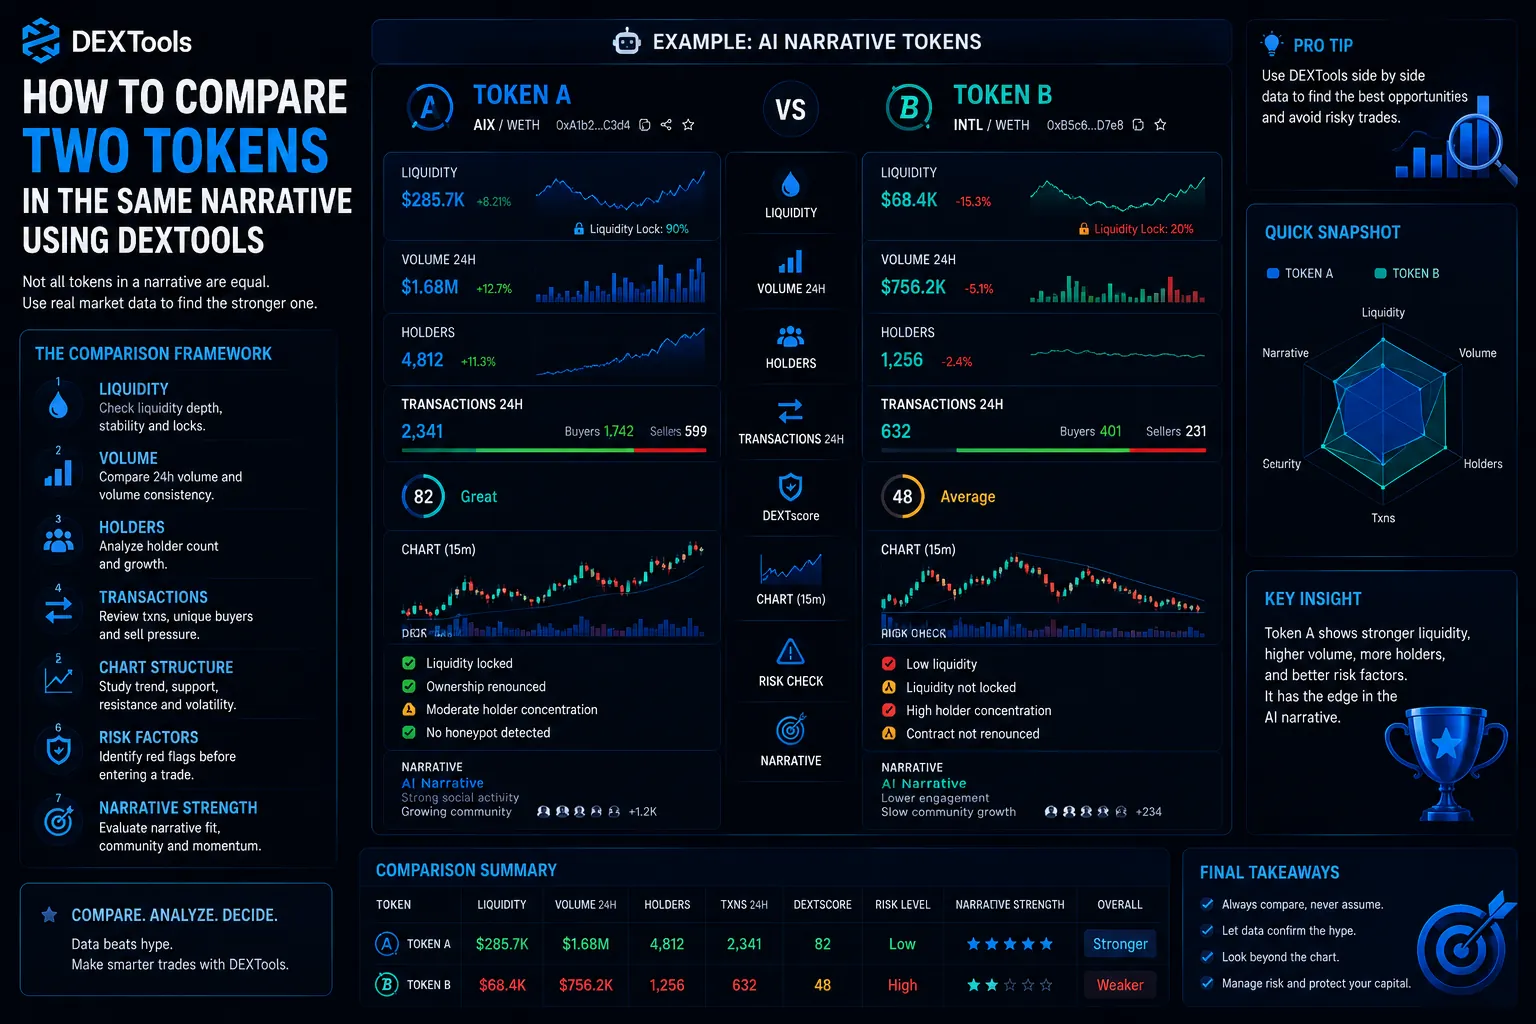
Step 4: Compare Holder Growth
Holder growth can help identify which token is gaining broader participation. A token with steady holder growth may suggest that more traders are joining over time.
However, holder count should be analyzed carefully. A sudden increase in holders may look positive, but it does not always mean organic demand. Some projects distribute tokens across many wallets, and some activity may not represent real market conviction.
Compare holder growth together with volume, liquidity, and transaction data. The best signal is when all of these grow in a balanced way.
Step 5: Compare Transaction Behavior
The transaction feed is one of the most useful tools for comparison. It shows how traders are behaving in real time.
When comparing two tokens, look at:
Number of unique buyers
Size of buys and sells
Frequency of sell pressure
Repeated activity from the same wallets
Large wallet behavior
Reaction after price pullbacks
If Token A has diverse buyers and steady accumulation, while Token B depends on a few large wallets, Token A may have a healthier base.
Transaction quality matters more than transaction noise.
Step 6: Compare Risk Signals
Every token has risk, but the type of risk can be different.
One token may have low liquidity. Another may have concentrated holders. Another may have strange transaction patterns. Another may be overextended after a large pump.
Using DEXTools, traders can build a side by side risk profile.
Ask:
Which token would be harder to exit?
Which token has more concentrated activity?
Which token depends more on hype?
Which token has stronger market support?
Which token has better data consistency?
The goal is not to find a perfect token. The goal is to identify which token offers a better balance between opportunity and risk.
Step 7: Compare Narrative Strength
A token does not move in isolation. It moves inside a broader story. If two tokens belong to the same narrative, traders should also compare how each one fits the market theme.
For example, if the narrative is AI, does one token have stronger branding, clearer positioning, or more active community interest? If the narrative is meme coins, does one token have stronger viral potential and better trading activity?
Narrative strength should never replace market data, but it can help explain why traders are paying attention.
A Simple Token Comparison Framework
When comparing two tokens, use this structure:
Liquidity: Which pool is stronger?
Volume: Which token has more sustainable activity?
Chart: Which one holds gains better?
Holders: Which one shows broader participation?
Transactions: Which one has healthier wallet behavior?
Risk: Which one has fewer warning signs?
Narrative: Which one fits the current market trend better?
This framework helps traders make decisions based on evidence instead of emotion.
Final Thoughts
Comparing tokens inside the same narrative is one of the most practical ways to use DEXTools. It helps traders move beyond hype and identify relative strength.
A token may look good alone, but comparison reveals whether it is truly strong or only benefiting from temporary attention.
In fast crypto markets, the best decision is rarely based on one metric. By comparing liquidity, volume, charts, holders, transactions, and risk, traders can build a clearer picture of which token deserves attention.
DEXTools is not just a discovery platform. It can also be a decision making tool for traders who want to think more strategically.
Liquidity Rotation: How Capital Moves Between Tokens Inside the Same Narrative Community vs Hype: Spot Real Token Support The Liquidity Decay Curve: How Token Markets Lose Depth Before They Lose Price Market Cap vs Liquidity: Which Matters More?