The DEXTools Data Literacy Guide for Crypto Traders
— By Whatsertrade in Tutorials
Learn how to understand DEXTools data and read liquidity, volume, holders, transactions, charts, and risk signals with better context.
DEXTools gives traders access to a large amount of token data. Charts, liquidity, volume, transactions, holders, pair information, and risk indicators can all help traders understand what is happening in decentralized markets.
But data alone is not enough.
Key Takeaways
- What Is Crypto Data Literacy?
- Liquidity: The First Layer of Market Reality
- Volume: Activity, Not Always Demand
- Transactions: Behavior Behind the Chart
- Holders: Distribution and Participation
- Chart Structure: Context for Price
Data literacy means knowing how to read, compare, and interpret information correctly. A trader with poor data literacy may see high volume and assume a token is strong. A trader with better data literacy asks why volume is high, who is trading, whether liquidity supports the move, and whether the chart confirms the activity.
This guide explains how to think about DEXTools data like a more disciplined trader.
What Is Crypto Data Literacy?
Crypto data literacy is the ability to understand what market data means and what it does not mean.
It includes knowing:
Which metrics matter first.
How different metrics connect.
When a signal is strong.
When a signal is misleading.
How to avoid emotional interpretation.
The goal is not to become a data scientist. The goal is to make better trading decisions by understanding the story behind the numbers.
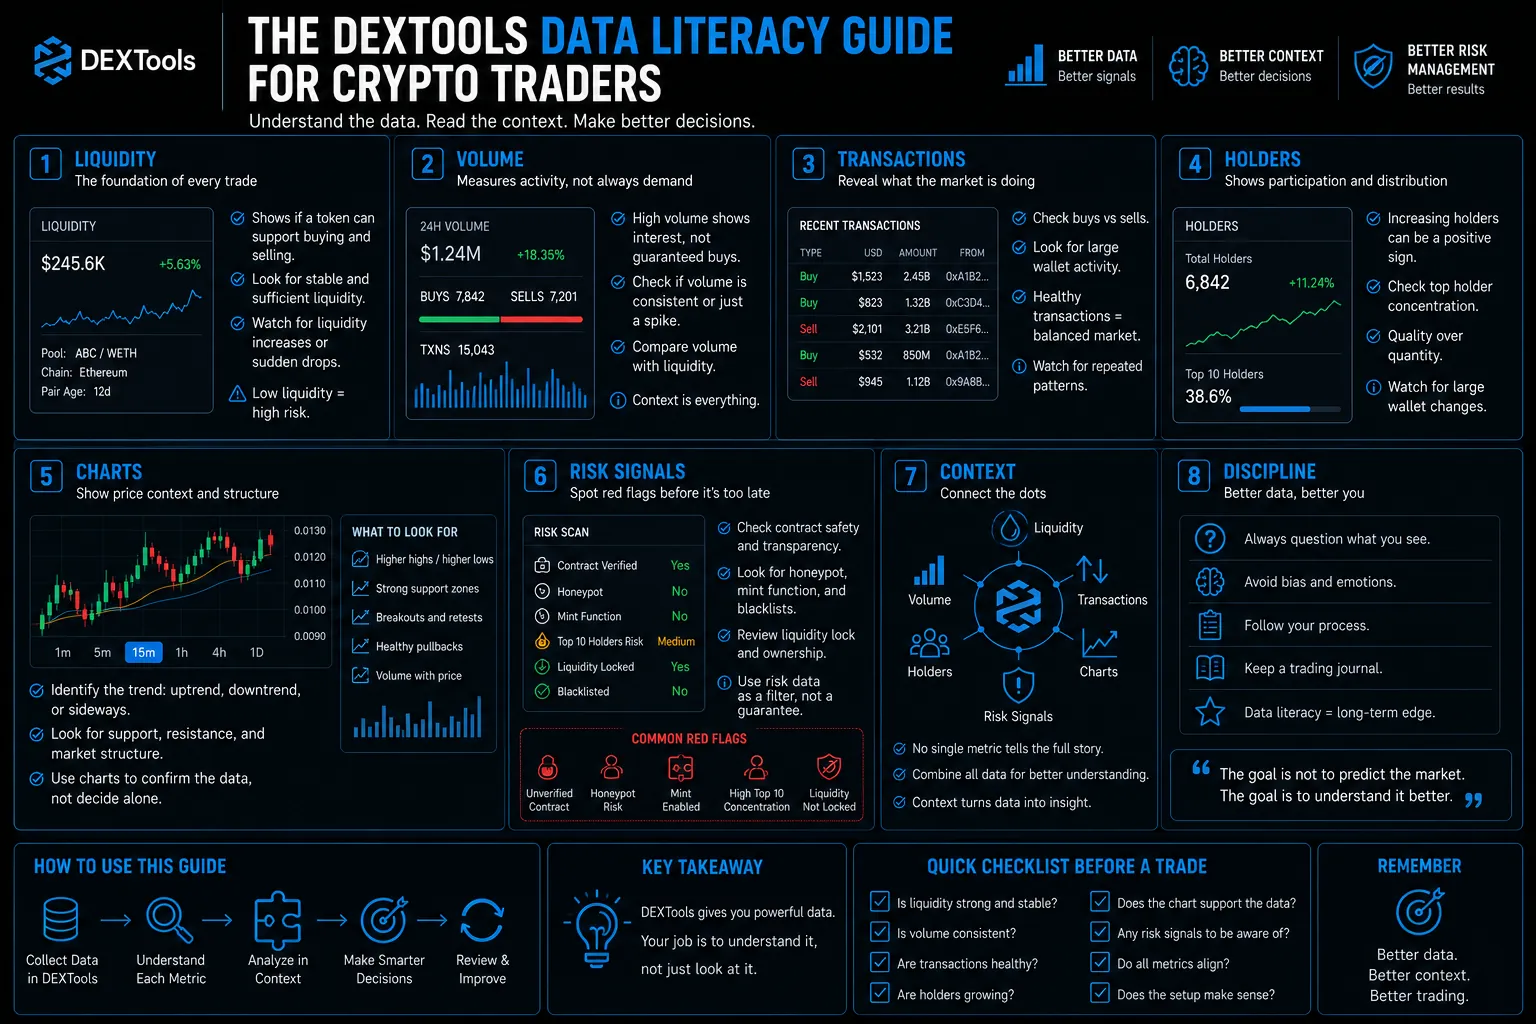
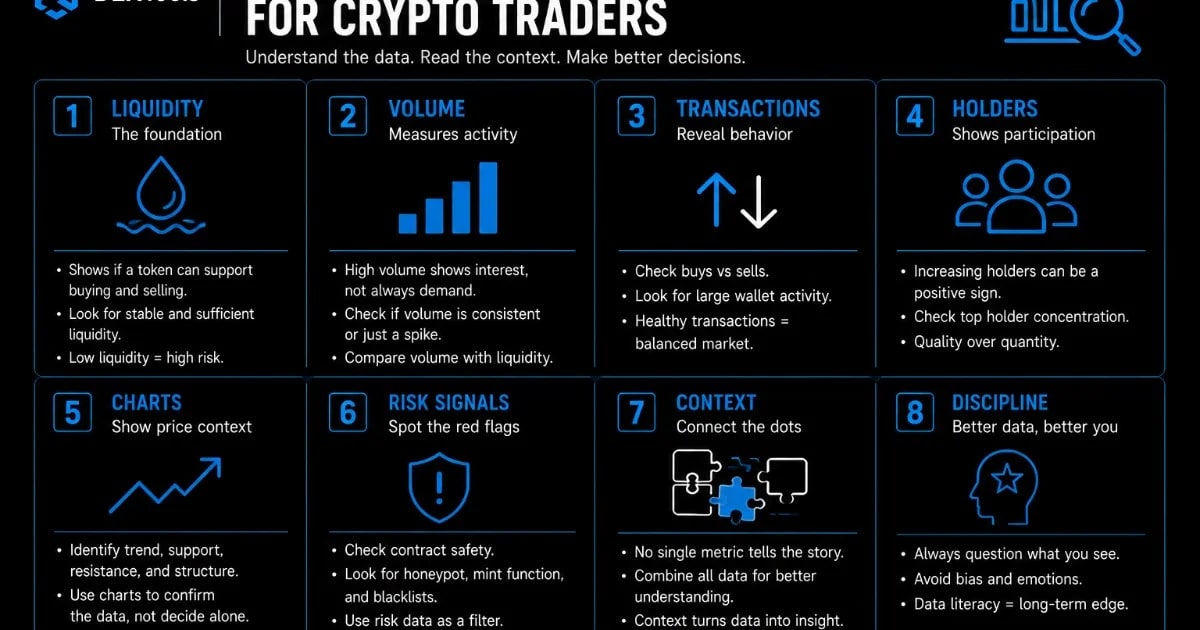
Liquidity: The First Layer of Market Reality
Liquidity shows whether a token can support buying and selling. A token can have a strong chart, but if liquidity is weak, the trade may still be risky.
When reading liquidity, ask:
Is liquidity deep enough?
Is liquidity stable?
Has liquidity changed recently?
Does liquidity match the current volume?
Can traders exit without extreme slippage?
Liquidity gives context to every other metric. Without it, price movement can become misleading.
Volume: Activity, Not Always Demand
Volume shows trading activity, but activity is not always healthy demand.
High volume can come from:
Real buyer interest.
Aggressive selling.
Short term flipping.
Repeated swaps.
Artificial or low quality activity.
Good data literacy means never reading volume alone. Always compare volume with liquidity, transactions, chart structure, and holder behavior.
Transactions: Behavior Behind the Chart
The transaction feed helps traders see what is happening behind price movement.
A chart shows the result. Transactions show the behavior.
Look for:
Buy and sell balance.
Large wallet activity.
Repeated patterns.
Buyer diversity.
Sell pressure after pumps.
If a token is rising but transactions show heavy selling, the chart may be weaker than it looks.
Holders: Distribution and Participation
Holder count can show whether participation is growing, but it can also mislead traders.
More holders does not always mean a stronger token. Some holders may own tiny amounts. Some wallets may be inactive. Some supply may still be concentrated at the top.
Use holder data to ask:
Is participation growing?
Are top holders too concentrated?
Are large wallets selling?
Are new holders meaningful buyers?
Holder data is most useful when combined with wallet behavior and price structure.
Chart Structure: Context for Price
A chart is often the first thing traders look at, but it should not be the only thing.
A strong chart usually shows:
Controlled pullbacks.
Higher lows.
Volume support.
Clear structure.
Resilience after selling.
A weak chart may show vertical movement, failed breakouts, or sharp reversals after hype.
Price tells you what happened. Structure helps you understand whether it can continue.
Risk Signals: A Filter, Not a Guarantee
Risk indicators help traders identify potential problems, but they should not create false confidence.
A cleaner risk profile does not automatically mean a good trade. A risky profile does not always mean an immediate collapse.
Use risk data as a filter. Then combine it with market behavior.
Final Thoughts
DEXTools data becomes powerful when traders understand how to read it in context. Liquidity, volume, transactions, holders, charts, and risk signals all tell part of the story.
Good data literacy means asking better questions. What is driving this move? Is the activity real? Can the token support exits? Are holders growing in a healthy way? Does the chart confirm the data?
The best traders do not only look at numbers. They understand what those numbers are trying to say.
Whale Buy or Exit Liquidity? How to Read Big Swaps Without Blindly Copying Whales Fake Volume vs Real Demand: How to Spot Artificial Momentum in DeFi Trading Locked Liquidity Is Not Enough: What Traders Still Need to Check When DEXTools Signals Disagree: How to Make Sense of Conflicting Token Data