When DEXTools Signals Disagree: How to Make Sense of Conflicting Token Data
— By Whatsertrade in Tutorials
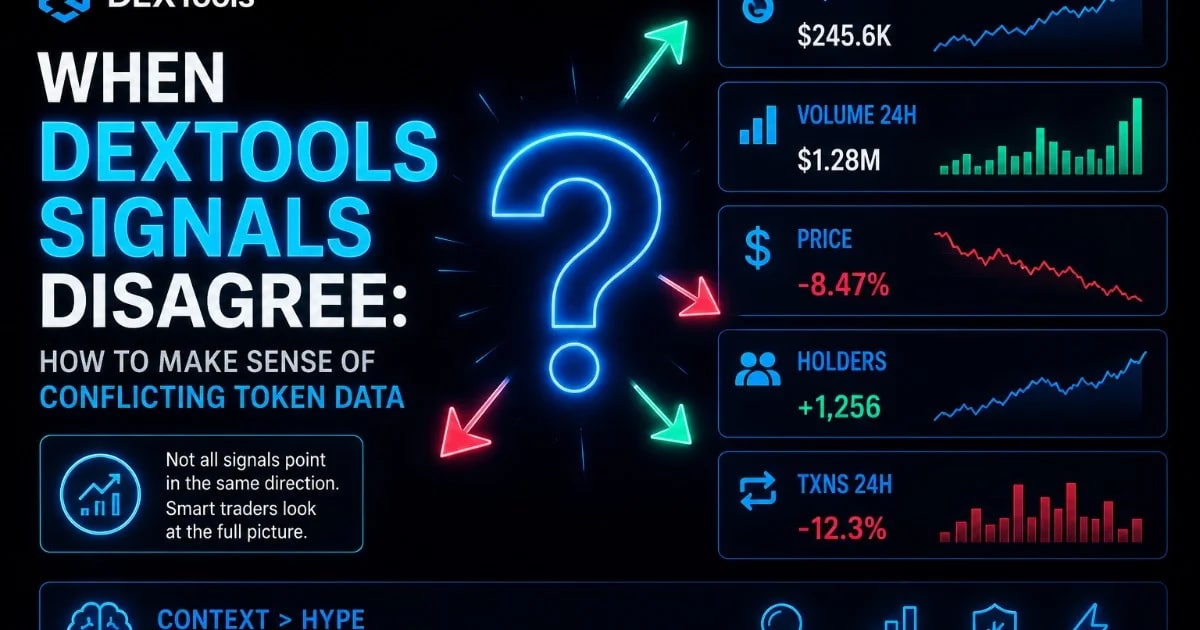
Learn how to interpret conflicting token data on DEXTools and make smarter crypto trading decisions using liquidity, volume, holders, and chart signals.
Crypto traders often want one clear answer: buy, wait, or avoid. But real market data is rarely that simple. A token may show strong volume but weak liquidity. Holder count may be rising while the chart looks tired. A token may trend for hours while large wallets quietly sell.
Key Takeaways
This is where DEXTools becomes more than a charting platform. It becomes a decision-making environment. The value is not only in seeing the data, but in knowing what to do when the data disagrees.
Conflicting token data is normal in decentralized markets. The key is learning how to separate strong signals from weak ones, and how to understand which metric matters most in the current situation.
Why Signals Disagree in Crypto Markets
DEX markets move fast. Liquidity, volume, price, transactions, holders, and wallet behavior can change within minutes. Because each metric measures a different part of the market, they do not always point in the same direction.
For example, volume can rise because new buyers are entering. But it can also rise because sellers are exiting aggressively. Holder count can increase because the community is growing. But it can also increase because small buyers are entering late while larger wallets reduce exposure.
A single metric can be useful. A group of metrics tells a better story. When those metrics conflict, traders need context.
Signal 1: Strong Volume, Weak Liquidity
This is one of the most important contradictions to understand. High volume can make a token look active and exciting, but weak liquidity can make the same token risky.
If volume is high but liquidity is low, every large buy or sell can move the price aggressively. This can create attractive candles, but it can also create painful exits.
Before reacting to high volume, ask:
Is liquidity deep enough to support trading activity?
Is liquidity stable or decreasing?
Would a large sell create heavy slippage?
If liquidity does not support the volume, the opportunity may be less solid than it appears.
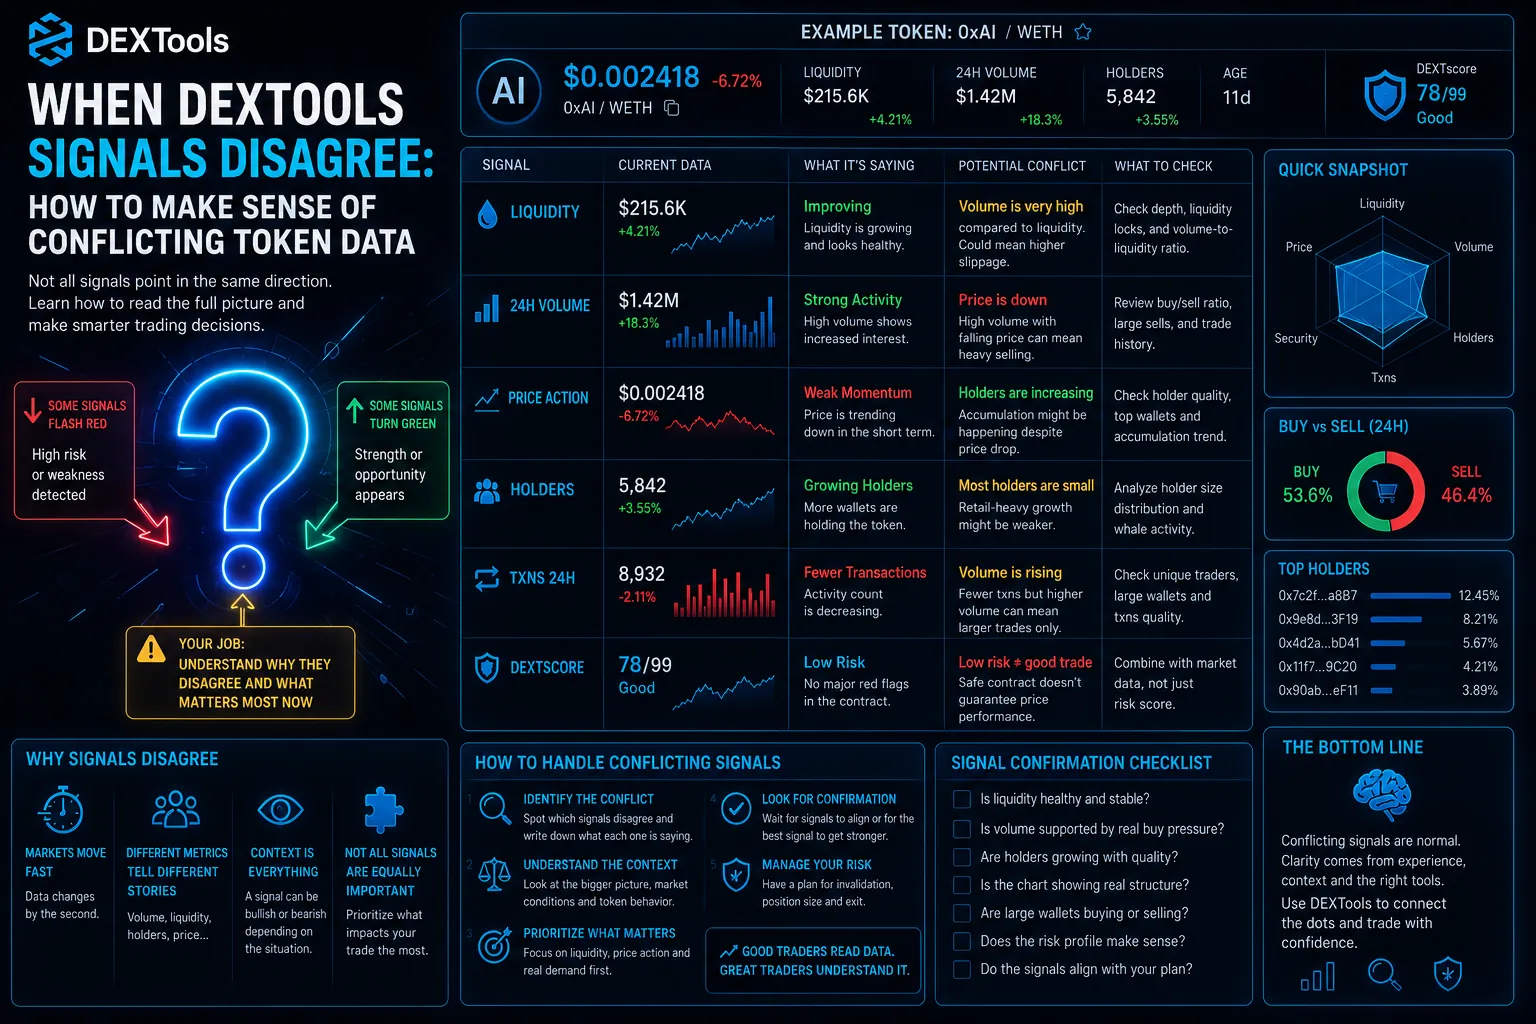
Signal 2: Rising Holders, Falling Price
A rising holder count is often seen as positive. But if the price is falling while holders increase, the market may be telling a more complicated story.
This can happen when small retail wallets are buying while larger holders are selling. It can also happen when buyers enter too late, after early participants have already taken profit.
In this situation, the question is not only “Are holders increasing?” The better question is “Who is buying, who is selling, and at what size?”
Holder growth matters most when it appears together with stable liquidity, healthy volume, and controlled price action.
Signal 3: Bullish Chart, Bearish Transactions
A chart can look strong while the transaction feed shows warning signs. This happens when price continues to rise but large sell orders start appearing regularly.
If every move higher is met with selling pressure, the trend may be weaker than it looks. The chart may still be moving up, but supply is entering the market.
Use DEXTools to check whether buyers are absorbing sell pressure or whether the token is becoming dependent on constant new demand.
A bullish chart with bearish transactions deserves caution.
Signal 4: Good DEXTscore, Weak Market Behavior
Risk indicators and scores can help traders quickly understand potential issues, but they should not replace market analysis.
A token may have a decent risk profile and still trade poorly. It may have stable contract signals but weak liquidity, low buyer interest, or an overextended chart.
Think of risk scores as one layer, not the full decision. A safer structure does not automatically mean a strong trade.
How to Prioritize Conflicting Signals
When DEXTools signals disagree, use this priority order:
First, check whether you can exit the trade. Liquidity and slippage matter before upside.
Second, check whether demand is real. Volume, transactions, and unique buyer behavior help answer this.
Third, check whether the chart supports the idea. Strong setups usually show structure, not only vertical movement.
Fourth, check whether holders confirm the trend. Holder growth is strongest when it matches price and volume behavior.
Fifth, check whether risk data supports the trade. Contract and safety indicators should confirm that the setup is worth considering.
A Simple Framework for Conflicting Data
Before entering, write one sentence:
“This token is interesting because…”
Then write the opposite:
“This token may be risky because…”
If the risk sentence is stronger than the opportunity sentence, wait. If the opportunity sentence depends on only one metric, wait. If the data tells a balanced story, continue your research.
Final Thoughts
Conflicting token data is not a problem. It is information. DEXTools gives traders access to multiple layers of market behavior, but those layers must be interpreted together.
The best traders do not look for one perfect signal. They look for alignment. When liquidity, volume, holders, transactions, chart structure, and risk data support the same idea, the setup becomes stronger.
When signals disagree, slow down. The market may be giving you a warning before the chart makes it obvious.
Holder Inflation: Why More Wallets Does Not Always Mean More Believers Liquidity Velocity: Why Fast LP Changes Matter More Than Total Liquidity The Whale Shadow: How Large Wallets Distort Retail Interpretation on DEX Charts Buyers vs Sellers Ratio: Why More Buyers Does Not Always Mean Strength