Bollinger Bands Explained: Volatility Trading Setups

Pure price charts create optical illusions that trap traders in false breakouts. We break down the compression and mean reversion setups needed to operate volatility.
The Pulse of Volatility: Moving Beyond Surface Price Changes
- In the global ecosystem of digital assets, nominal price is an incomplete metric. Because cryptocurrencies operate on a continuous liquidity matrix 24 hours a day, 7 days a week, traditional candlestick charts often generate immense visual noise. A vertical bullish candle might be interpreted by the retail mass as the start of an unstoppable macroeconomic expansion; however, beneath the surface, money velocity and statistical dispersion may indicate that the movement lacks structural support. Conversely, an aggressive drop might sow panic in social forums, hiding the fact that the asset is simply experiencing a normal mathematical fluctuation within a predictable range.
- To survive this environment, institutional participants and quantitative analysts do not just look at where the price is going, but with what force and dispersion it moves. At the heart of this evaluation lies the concept of volatility, the measure of the frequency and intensity of price variations for an asset over a given period. When volatility plummets, the market enters a state of latent compression; when it spikes, capital reorganizes violently, breaking technical levels and liquidating over-leveraged positions.
- To map this invisible force in a visual and mathematical way, legendary analyst and investor John Bollinger developed Bollinger Bands in the early 1980s. By combining a central trend line with statistical envelopes based on standard deviation, this non-linear indicator became a fundamental pillar of financial telemetry.
- In the crypto market, Bollinger Bands act as a dynamic container that expands and contracts organically in response to order flow. This technical guide will detail the mathematical architecture of the bands, the analytical operation of compression phases (the Squeeze), the mechanics of extended trends (Walking the Band), mean reversion patterns, and essential risk management protocols for trading high-probability volatility setups.
1. The Technical Architecture: Deconstructing the Three Bands
The Middle Band: The Trend Anchor
The central axis of the indicator is a default 20-period Simple Moving Average (SMA). This line functions as the asset's equilibrium base. It represents the smoothed average value upon which volatility calculations are performed. If the price consistently trades above the 20 SMA, the market inertia is bullish; if it trades below, sellers maintain temporary control of the order book.
The Outer Bands and Standard Deviation
The true power of the indicator lies in its upper and lower boundaries. Unlike other trading channels that simply shift lines by a fixed percentage, Bollinger Bands utilize Standard Deviation, a statistical metric that quantifies the variability or dispersion of a data set relative to its mean.
The standard universal configuration applies two standard deviations above and below the central line:
Upper Band: SMA of 20+(2×Standard Deviation)
Lower Band: SMA of 20−(2×Standard Deviation)
- Under a normal statistical distribution, Chebyshev's theorem and the laws of probability dictate that approximately 95% of price action should occur naturally within these outer boundaries. Therefore, when price breaches or interacts with the outer bands, it is not a routine event; we are witnessing a low-probability mathematical anomaly that demands diagnostic attention.
- The bands act like rubber bands: the more they are stretched due to an abrupt movement, the greater the statistical force attempting to pull the price back toward its central axis.
2. The Bollinger Bands Squeeze: The Calm Before the Storm
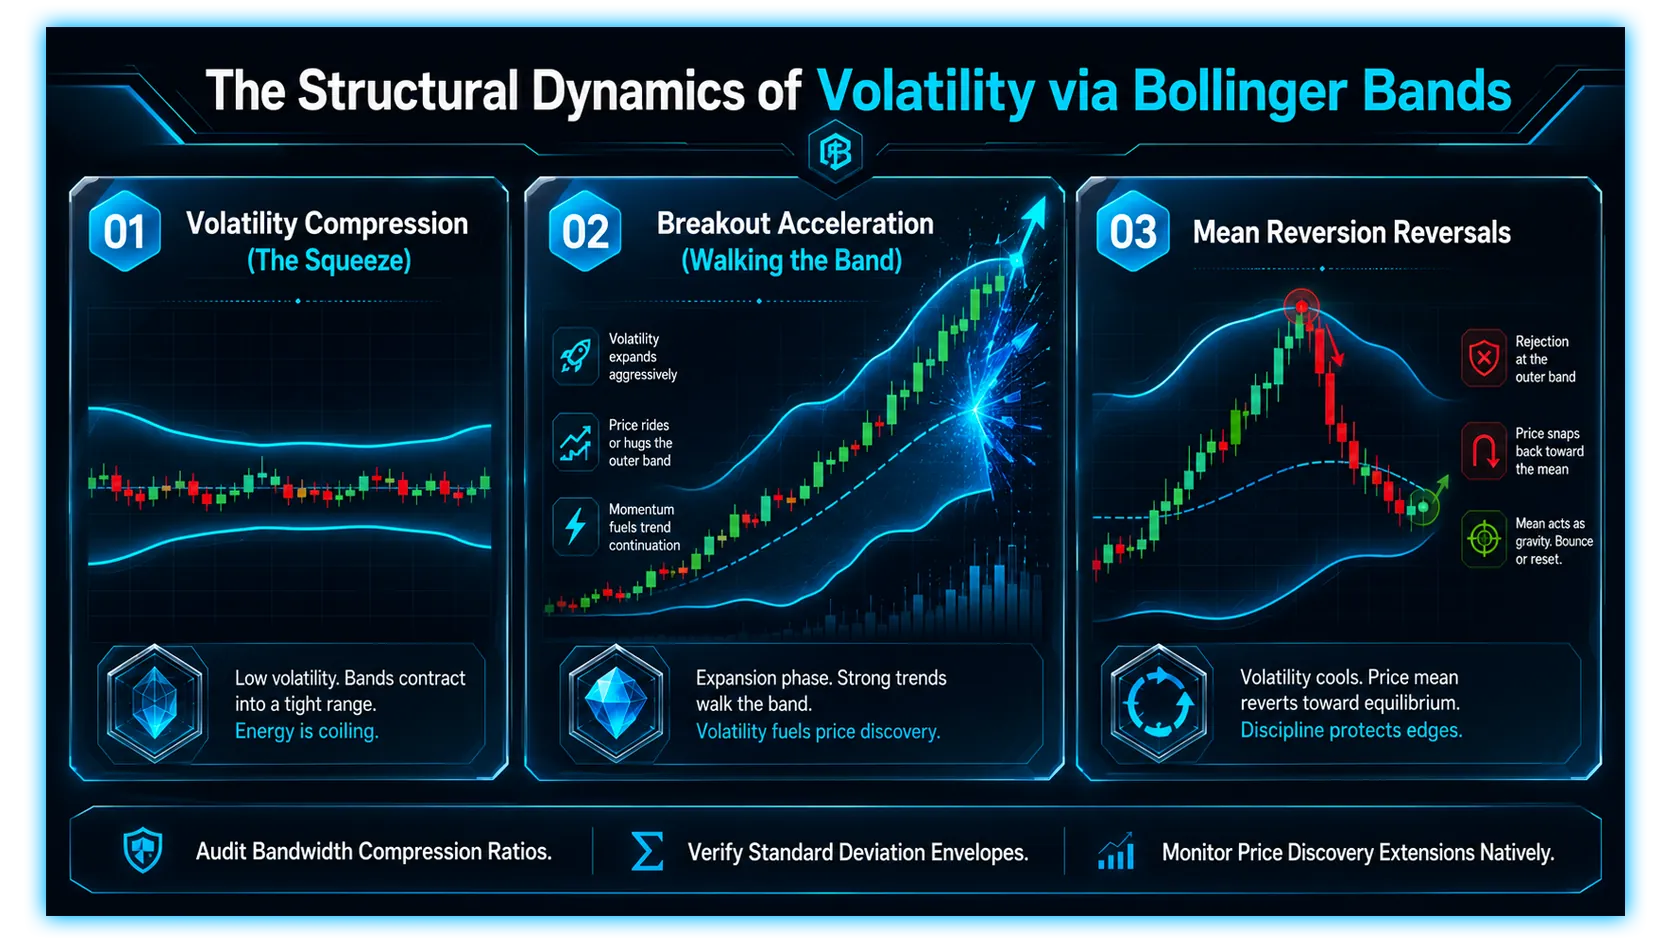
One of the most important axioms of market microstructure is that volatility is cyclical. Markets do not pass directly from an aggressive bullish trend to a vertical bearish trend; they continuously oscillate between periods of high volatility and phases of low volatility. The most famous and lucrative setup designed by John Bollinger capitalizes on this transition: the Bollinger Band Squeeze.
The Mechanics of Coiled Compression
- When a crypto asset enters a prolonged phase of horizontal consolidation or silent accumulation, the price fluctuation range narrows extremely. Because daily variations relative to the mean are notably reduced, the standard deviation value plummets. As a direct mathematical consequence, the upper and lower outer bands begin to contract toward the central SMA, drawing a geometric bottleneck on the chart.
- This narrowing indicates that the market is storing mass amounts of energy. The longer the bands remain in a state of severe compression, the more violent and implacable the subsequent expansion will be. Institutional market makers take advantage of this retail boredom to absorb liquidity silently before initiating a directional movement.
Identifying the Breakout and the Danger of the Head Fake
To quantify the intensity of a compression, traders use the derived Bandwidth indicator, which calculates the exact distance between the upper and lower bands. When Bandwidth marks multi-month lows, the Squeeze is ripe to trade.
The setup trigger activates when a candle with significantly higher-than-average trading volume breaks and closes outside one of the outer bands:
Bullish Breakout: A forceful close above the upper band indicates that the compressed energy has released toward the buyers' side, validating a long entry.
Bearish Breakout: A close below the lower band confirms that sellers have taken control of order flow, authorizing a short position or a hedging exit into stablecoins.
However, the crypto market has a recurring structural trap designed to clear minor leverage: the Head Fake. This manipulation is executed when market makers initially push price forcefully through the lower band to activate retail traders' stop-loss orders and collect liquidity. Once the necessary liquidity is captured, price reverses vertically in the next candle, breaking the upper band and initiating the true expansive bullish trend, leaving lagging traders trapped.
3. Walking the Bands: Riding the Wave
- A critical error systematically made by beginner traders is assuming that because 95% of price action must occur within the bands, touching the upper band automatically functions as an "overbought" sell signal, and touching the lower band as an "oversold" buy signal.
- John Bollinger has repeated countless times that price contact with the outer bands is a statement of strength, not an automatic reversion signal. When a crypto asset enters a macroeconomic and institutional tendential market, the phenomenon known as Walking the Bands manifests.
The Dynamics of Tendential Acceleration
- When an expansion phase unleashes with massive institutional volume behind it, price breaks the upper band and begins to glide continuously along the outer boundary. In this scenario, the upper band expands parabolically upward, acting as a dynamic ceiling that rises at the same pace as price acceleration.
- Shorting an asset that is "walking the upper band" is one of the fastest ways to suffer a forced liquidation due to a Short Squeeze. This behavior demonstrates that spot or derivatives demand is so overwhelming that it is actively altering traditional statistical distribution, pushing standard deviation limits to extreme levels sustainably.
Validation of Continuity and the Centerline Filter
To confirm that an asset is effectively walking the band healthily and not executing an exhaustive short-term escape, the analyst must monitor the slope of the central 20-period SMA and the behavior of the opposite band:
Divergent Expansion: In a true expansive breakout, while the upper band rises vertically following the candles, the lower band must open in the opposite direction (downward). This confirms a drastic increase in total system volatility.
Central SMA Support: During temporary pullbacks and interruptions of the bullish trend, price should never execute a formal close below the central 20-period moving average. In an optimal continuity setup, the 20 SMA functions as an infallible dynamic trampoline; every touch of the centerline on the 4-hour or daily chart represents a high-probability accumulation zone to continue riding the expansive wave.
4. Mean Reversion Strategies in Horizontal Channels
Although compression and expansion garner the most attention in trading literature, assets trade within well-defined lateral ranges most of the time. When macro telemetry confirms that the market lacks an immediate directional catalyst and moves laterally, Bollinger Bands transform into a Mean Reversion tool of surgical precision.
W-Bottom Setups (Bollinger Double Bottoms)
- The W-Bottom pattern, formalized by Arthur Merrill and adapted by John Bollinger to the bands, is one of the most reliable reversion setups for identifying the end of a local correction within a horizontal range.
- This pattern reveals that although sellers attempted to push the nominal price to a lower level on the second attempt, volatility force and statistical dispersion contracted notably, demonstrating that selling pressure has completely exhausted. The buy confirmation is activated when price surpasses the local high established in the intermediate bounce, projecting the upper band as the technical target.
M-Top Setups (Bollinger Double Tops)
Symmetrically, the M-Top pattern deploys in upper resistance zones of horizontal channels to structure short operations or strategic capital exits:
The First Impulse: The asset experiences an aggressive rally that breaks or closes outside the upper band, reflecting a transitory state of retail greed in the order book.
The Central Correction: Price is rejected and retraces looking for the 20-period central SMA equilibrium.
The Second Exhaustive Impulse: Buyers attempt to resume the bullish structure, pushing price toward the previous high (sometimes achieving a slightly higher nominal high), but the candle line remains strictly below or within the upper band. This confirms that money velocity has completely decelerated and that the asset has entered a terminal distribution phase, setting the stage for a severe contraction toward the lower band.
Volatility Setup Classification
| Technical Setup | Market Condition | Execution Trigger | Primary Target |
| Bollinger Squeeze | Extreme Compression | Close outside the band with volume | Tendential Expansion |
| Walking the Bands | Exponential Trend | Continuous band touch + sloped SMA20 | Dynamic Continuity |
| W-Bottom (Double Bottom) | Lateral Horizontal Range | Internal reversion candle at second low | Upper Band |
| M-Top (Double Top) | Lateral Horizontal Range | Expansion failure at upper band | Lower Band |
Deviation Control Metrics
| Statistical Range | Containment Probability | Breakout Meaning | Operational Action |
| Within $\pm 2\sigma$ | ~95% | Normal market fluctuation | Trade reversions in ranges |
| Breakout $+2\sigma$ | ~2.5% probability | Extreme strength or parabolic exhaustion | Validate volume to discern |
| Breakout $-2\sigma$ | ~2.5% probability | Severe capitulation or downtrend start | Monitor structural support |
5. Integrating Telemetry Auditing via DEXTools
- As you secure your seed phrase storage and hardware wallet setup, maintaining visibility over decentralized markets remains essential. DEXTools provides advanced analytics to monitor live token behavior, liquidity pools, contract data, and market activity across public blockchain networks.
- With tools like Pair Explorer, Live New Pairs, Trade Story, Top Traders, and Big Swap Explorer, traders can audit volume trends, track whale movements, review liquidity depth, and check contract safety before interacting on-chain. This helps ensure secured wallets engage only with verified and liquid market venues while private keys remain safely protected offline.
Disclaimer: This article is for informational purposes only and does not constitute investment advice, financial advice, trading advice, or any other kind of advice. DEXTools does not recommend buying, selling, or holding any cryptocurrency or token. Users should conduct their own research and consult with a qualified financial advisor before making any investment decisions. Cryptocurrency investments are volatile and high-risk. DEXTools is not responsible for any losses incurred.