The No-Buy Checklist: 12 Times DEXTools Data Tells You to Walk Away
— By Whatsertrade in Tutorials
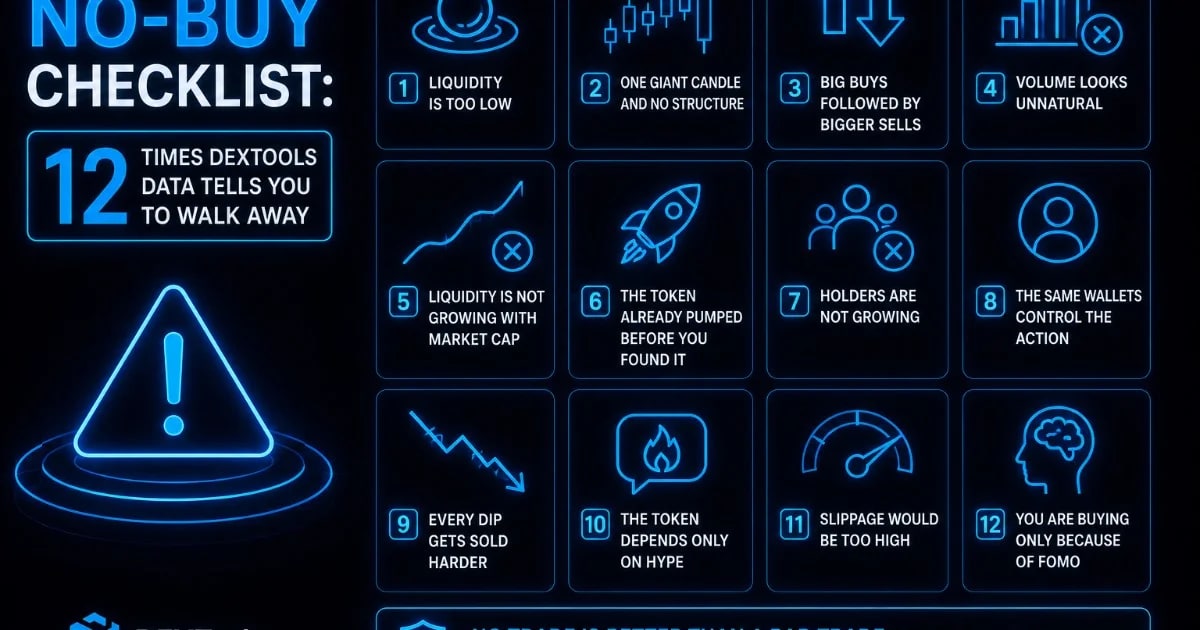
Most crypto traders spend too much time looking for reasons to buy. They search for the next gem, the next breakout, the next low-cap token that could move fast
Most crypto traders spend too much time looking for reasons to buy. They search for the next gem, the next breakout, the next low-cap token that could move fast.
But sometimes the best trade is no trade.
Key Takeaways
- 1. Liquidity Is Too Low
- 2. The Chart Has One Giant Candle and No Structure
- 3. Big Buys Are Followed by Bigger Sells
- 4. Volume Looks Unnatural
- 5. Liquidity Is Not Growing With Market Cap
- 6. The Token Already Pumped Before You Found It
DEXTools gives traders access to real-time market data, charts, transactions, liquidity information, and token activity. Used correctly, it can help you find opportunities. More importantly, it can help you avoid bad ones.
This no-buy checklist is designed to help you recognize when the data is telling you to walk away.
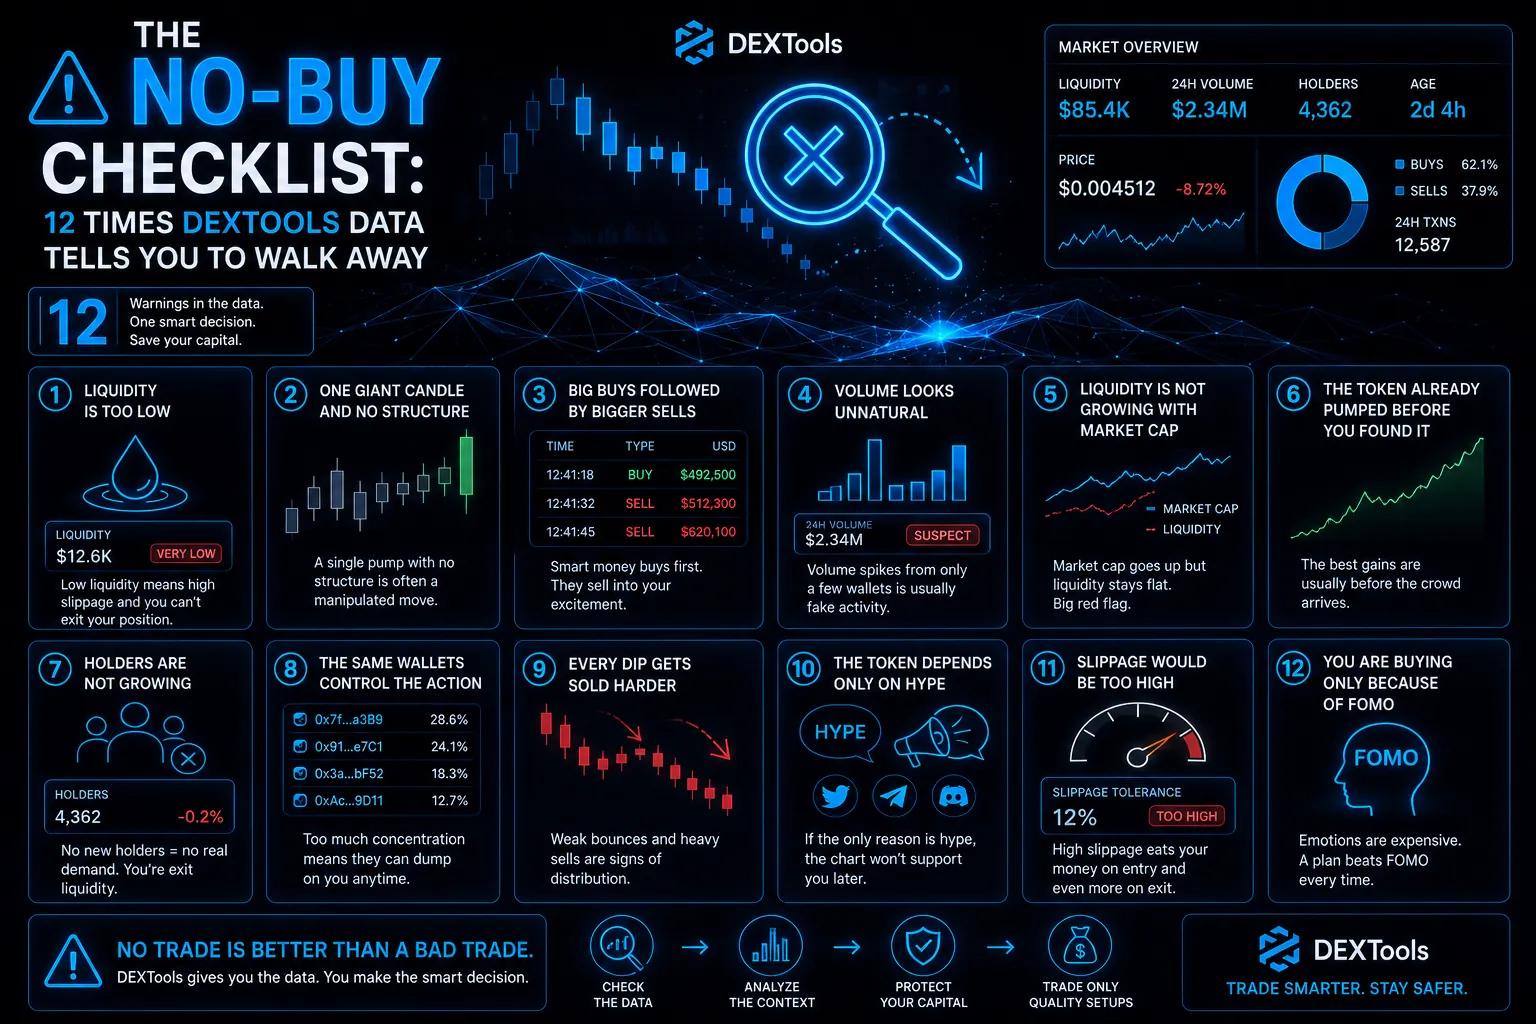
1. Liquidity Is Too Low
Low liquidity is one of the biggest risks in decentralized trading. A token can look like it is pumping, but if the pool is too small, entering and exiting can be difficult.
Low liquidity can cause high slippage, unstable price action, and sudden crashes after only a few sells.
If your position would represent a large percentage of the available liquidity, the trade is already risky.
2. The Chart Has One Giant Candle and No Structure
A single green candle does not make a strong setup.
If the chart shows no base, no consolidation, and no previous buying interest, the move may be artificial. One large buy can make a token look strong for a few minutes, but without follow-through, the price can reverse quickly.
A healthy chart usually builds structure before moving higher.
3. Big Buys Are Followed by Bigger Sells
A big buy can attract attention, but what happens next matters more.
If large wallets buy and then early wallets sell into the momentum, retail traders may be entering too late. Always check recent transactions and look for distribution.
A bullish move should not immediately become an exit door for earlier holders.
4. Volume Looks Unnatural
Volume should support the trend. But not all volume is healthy.
Be careful if volume appears suddenly after long inactivity, comes from only a few wallets, or does not match holder growth. Fake or manufactured activity can make a token look more popular than it really is.
Organic volume usually comes from a wider group of traders over time.
5. Liquidity Is Not Growing With Market Cap
If market cap rises quickly but liquidity stays low, the token may become fragile.
A high market cap with thin liquidity can create the illusion of value. In reality, only a small amount of selling pressure may be enough to move the price down sharply.
Strong tokens usually attract deeper liquidity as interest grows.
6. The Token Already Pumped Before You Found It
Many traders discover tokens after the easy move has already happened.
If the chart has already gone vertical, risk usually increases. Buying after a massive pump means your entry depends on someone else paying a higher price.
Before entering, ask whether the risk-to-reward still makes sense.
7. Holders Are Not Growing
A token can show volume without real adoption.
If holders are not increasing while the price is rising, the move may be driven by a small group of wallets. This can create instability because control is concentrated.
Healthy growth usually includes new holders, steady volume, and stronger liquidity.
8. The Same Wallets Control the Action
If only a few wallets are responsible for most of the trading activity, the market may not be organic.
Concentrated activity creates risk. A few wallets can push the chart up, attract buyers, and then sell into the market.
Before buying, check whether activity looks broad or controlled.
9. Every Dip Gets Sold Harder
A healthy token can pull back and recover. A weak token often bounces slightly and then sells off again.
If every recovery attempt is met with strong selling, the market may be under distribution. That means sellers are using buyer interest to exit.
Repeated weak bounces are often a warning sign.
10. The Token Depends Only on Hype
Social media attention can move tokens, but hype without on-chain support is risky.
If the token is trending online but DEXTools data shows weak liquidity, suspicious volume, and poor holder growth, the market may not be as strong as it looks.
Always compare social hype with real trading data.
11. Slippage Would Be Too High
If you need to increase slippage too much just to enter or exit, that is a warning.
High slippage can mean low liquidity, high volatility, or aggressive token mechanics. It can also make your actual entry much worse than expected.
A trade that looks profitable on the chart may not be profitable after slippage.
12. You Are Buying Only Because of FOMO
DEXTools gives you data, but you still need discipline.
If you are buying because the candle is green, the chat is excited, or you are afraid of missing out, stop. Emotional entries often happen at the worst prices.
A good setup should make sense before the hype, not only during it.
Final Thoughts
The no-buy checklist is not about being negative. It is about protecting your capital.
DEXTools can help you find strong tokens, but it can also help you avoid dangerous ones. Low liquidity, unnatural volume, weak holder growth, suspicious transactions, and vertical charts are all reasons to slow down.
In DeFi trading, avoiding bad trades is just as important as finding good ones.
Before you buy, check the data. If too many warning signs appear, walking away may be the smartest move.
Fake Volume vs Real Demand: How to Spot Artificial Momentum in DeFi Trading Apparent Liquidity vs Executable Liquidity: Why a Large Pool Can Still Give You a Bad Entry How to Check if a Token Can Actually Be Sold Before Buying (2026) How to Read Liquidity Pool Data Before Buying a Token (2026)The Phantom Volume Trap: When High Liquidity Hides Deception
One of the most insidious signals to walk away from is the "phantom volume" trap, often masked by seemingly robust liquidity metrics. While DEXTools excels at showing real-time liquidity pools and transaction data, a deeper dive is required to discern genuine investor interest from manipulative tactics. High reported liquidity, especially in new or obscure tokens, can be artificially inflated by the project's own team or bots, creating a false sense of security and depth. This isn't just about wash trading; it's about a project providing its own capital to the liquidity pool to meet minimum thresholds, only to pull it later, leaving genuine investors holding the bag.
Phantom volume often accompanies tokens with very few unique holders despite large reported market caps or trading volumes. The illusion of activity draws in retail investors who see the large numbers and assume a healthy, active market. However, without a diverse distribution of token holders and organic transaction patterns, that liquidity is a mirage. When the project team decides to rug, the "liquidity" evaporates, leaving no real buyers to absorb sell pressure.
Spotting the Deceptive Depth
- Examine Holder Distribution: Use DEXTools' holder analysis to check for a highly concentrated ownership, especially by a few wallets or contract addresses that also control a significant portion of the liquidity.
- Analyze Transaction Frequency and Size: Look beyond just total volume. Are transactions consistently small, or are there large, infrequent transactions that inflate the numbers without genuine trading activity?
- Monitor Liquidity Pool Movements: Pay close attention to the LP add/remove events. Suspiciously large initial adds followed by significant, unannounced withdrawals are red flags.
- Cross-Reference with Social Sentiment: While not a DEXTools metric, combine the data with a quick check of community sentiment. Is the project's "buzz" organic, or does it feel forced and bot-driven?
Related Guides
- DEXTools for Project Teams: A Pre Launch Visibility Checklist for New Tokens
- How to Verify Token Safety Before Buying: A Pre-Buy Crypto Checklist
- What Is Walrus Protocol: WAL Decentralized Storage Guide 2026
- Wallet Security Checklist: 10 Must-Do Steps Before Holding
- Token Analysis: First 48 Hours Checklist (2026 Sniper Guide)
Frequently Asked Questions
What is DEXTools and how does it help crypto traders?
DEXTools is a platform that provides real-time data and tools for decentralized exchange (DEX) trading. It helps traders analyze token prices, liquidity, trading volume, and other metrics to make informed decisions and identify potential risks or opportunities in the market.
How can DEXTools data indicate a project might be a 'rug pull' or scam?
DEXTools data can signal a rug pull through sudden, massive liquidity removal, a rapid price crash with no recovery, or a very low liquidity pool from the start. It might also show a token with extremely concentrated holder distribution, where a few wallets own most of the supply, allowing them to manipulate the price.
What DEXTools metrics suggest I should walk away from a crypto project?
You should consider walking away if DEXTools shows extremely low liquidity, a consistently declining price with no buyer interest, or a very high percentage of tokens held by a few wallets (whale concentration). Also, be wary of projects with little to no trading volume or a consistently high sell pressure without corresponding buys.
Can DEXTools help identify legitimate, promising crypto projects?
Yes, DEXTools can help identify promising projects by showing consistent trading volume, growing liquidity, a healthy distribution of token holders, and a stable or growing price trend. It can also highlight projects with active communities and transparent contract information, indicating a more legitimate and potentially successful venture.