What Happens 24 Hours After a Token Enters Trending?
— By Whatsertrade in Tutorials

Discover key indicators to analyze token movements after trending. Learn how to identify real support versus hype-driven volatility in the crypto market.
When a token enters Trending, attention arrives fast. Traders notice the chart, social channels become louder, buy pressure can accelerate, and the market starts asking the same question: is this the beginning of a real move or just another short lived pump?
Trending visibility can be powerful, but it can also be misleading. A token can appear strong for a few minutes while hiding weak liquidity, concentrated wallets, artificial volume, or a community driven only by hype. The first 24 hours after a token starts trending often reveal whether the move has real support or whether the early excitement is already fading.
This article explains how to analyze what happens after a token enters Trending and which signals traders should watch before making decisions.
Why Trending Matters
Trending sections are useful because they show where market attention is moving right now. In decentralized markets, attention is often the first fuel behind volume. A token that enters Trending can attract more traders, more chart watchers, more social posts, and more liquidity.
However, Trending does not automatically mean quality. It means activity. That activity can come from real buyers, coordinated campaigns, bots, liquidity games, or a short term speculative wave.
The key is not simply asking whether a token is trending. The better question is: what happens after it starts trending?
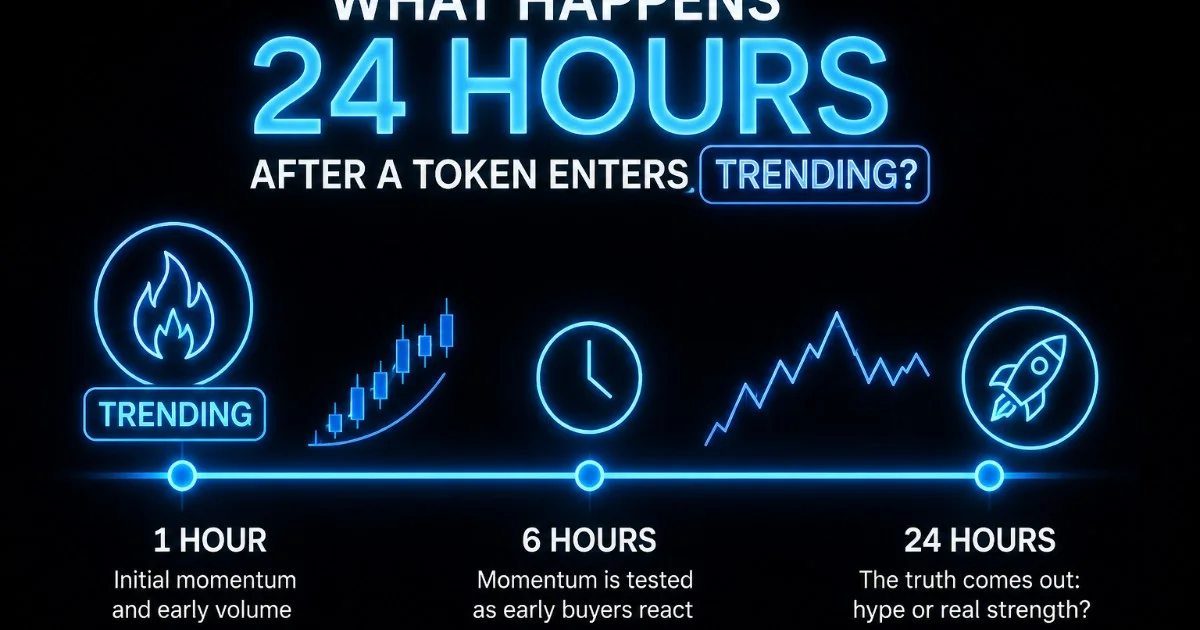
The First Hour: Initial Momentum
The first hour usually shows the strength of the first reaction. Traders should look beyond the green candle and focus on the structure of the move.
Important signals include:
- Volume compared with liquidity
- Number of unique buyers
- Size of repeated buys
- Speed of sell pressure after each pump
- Whether liquidity is growing or staying flat
- Whether the chart is forming higher lows or only one vertical spike
A healthy early move often shows rising volume, multiple buyers, and controlled pullbacks. A weaker move may show aggressive candles followed by fast selloffs, very few wallets driving most of the action, or volume that appears too high compared with available liquidity.
The 6 Hour Check: Does Momentum Survive?
Many tokens look strong for 30 minutes. Fewer remain strong after six hours.
The six hour mark is useful because it shows whether the market is still interested after the first wave of attention. By this point, early buyers may start taking profits. If the token can absorb selling pressure and still maintain a stable structure, that can be a positive sign.
Traders can look for:
- Liquidity stability
- Continued holder growth
- New buyers entering after the first pump
- Less violent volatility
- Higher lows on the chart
- Reduced dependence on one or two large wallets
If volume collapses completely after the first spike, it may suggest the token was driven mainly by early hype. If volume remains active but price becomes more stable, the token may be entering a healthier discovery phase.
The 24 Hour Test: Hype or Real Market Interest?
The 24 hour mark is where many weak launches begin to show their real condition.
A token with real market interest often has a broader base of holders, a more balanced buy and sell flow, and visible attempts to build support levels. A token driven only by hype often shows a major candle, a sharp retrace, declining volume, and little new participation.
At this stage, traders should compare:
- Current price versus the first Trending price
- Current liquidity versus launch liquidity
- Number of holders after 24 hours
- Buy and sell distribution
- Market cap compared with actual pool depth
- Social activity compared with chart activity
The best tokens are not always the ones with the biggest first candle. Sometimes the stronger setup is a token that trends, retraces, consolidates, and then attracts new buyers without losing its liquidity base.
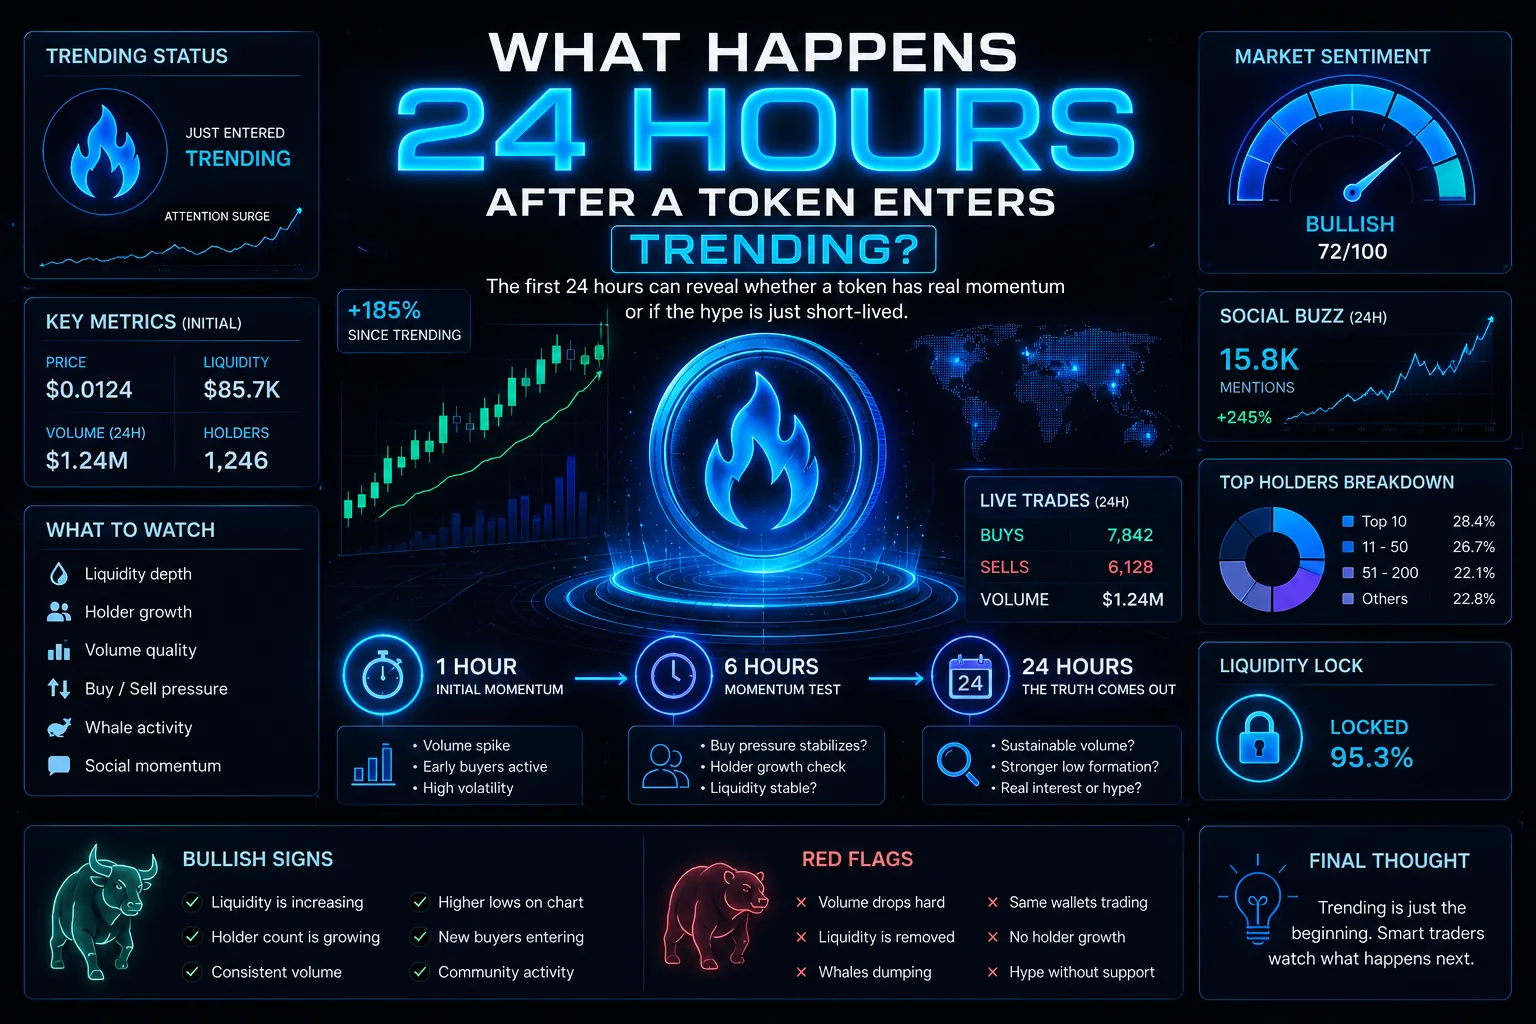
Red Flags After a Token Trends
Trending can also attract manipulation. Some warning signs include:
- Huge volume with very low liquidity
- Repeated identical transactions
- A chart that only moves when a few wallets buy
- Liquidity removal after visibility increases
- Large holders selling into every pump
- Many buyers but no meaningful holder growth
- A market cap that looks large but cannot support real selling
Another major red flag is a token that depends entirely on constant promotion. If attention slows and the chart immediately collapses, the token may not have real demand underneath the hype.
Positive Signs After Trending
Not every trending token is dangerous. Some use early attention to build real traction.
Positive signs may include:
- Liquidity increasing over time
- More unique wallets buying
- Sell pressure being absorbed without major collapse
- Consistent trading activity after the first spike
- Stronger support levels forming
- A balanced chart rather than one single vertical candle
- Community activity that continues after the first pump
The goal is to separate temporary excitement from sustainable market behavior.
A Simple 24 Hour Framework
Traders can use this simple framework when analyzing a token after it enters Trending:
Hour 1: Is the move organic or too concentrated?
Hour 6: Is volume still active after the first wave?
Hour 24: Did the token build a stronger base or lose attention?
This framework does not predict the future, but it helps traders avoid reacting only to the first candle. In decentralized markets, patience can be an edge.
Final Thoughts
A token entering Trending is not a buy signal by itself. It is an invitation to investigate.
The first 24 hours can reveal whether a token has real momentum, active buyers, stable liquidity, and growing market interest. It can also reveal weak structure, artificial volume, and early exits by insiders.
The smartest traders do not chase Trending blindly. They study what happens next.
The Attention Decay Curve: How to Know When a Trending Token Is Losing Power Fake Volume vs Real Demand: How to Spot Artificial Momentum in DeFi Trading Community vs Hype: Spot Real Token Support The Liquidity Decay Curve: How Token Markets Lose Depth Before They Lose PriceFrequently Asked Questions
What is a token?
A token is a digital asset that represents a utility or value on a blockchain. It can be fungible, meaning interchangeable, or non-fungible, meaning unique.
How do tokens become trending?
Tokens often gain trending status through increased trading volume, social media mentions, news events, or listings on major exchanges. Community engagement and project developments also contribute.
What happens after a token trends?
After trending, a token may experience increased price volatility, higher trading liquidity, and greater public awareness. It can attract new investors and users to its ecosystem.
Are trending tokens a good investment?
Trending status does not guarantee a token's long-term success or investment value. Researching the project's fundamentals, use case, and team is crucial before making any investment decisions.
What are the risks associated with trending tokens?
Trending tokens can be susceptible to pump and dump schemes, market manipulation, and rapid price corrections. Investors should be aware of these risks and exercise caution.