The DEXTools Context Layer: Why the Same Metric Means Different Things in Different Markets
— By Whatsertrade in Tutorials
Learn why the same DEXTools metric can mean different things depending on market conditions, token age, liquidity, narrative, and trading environment.
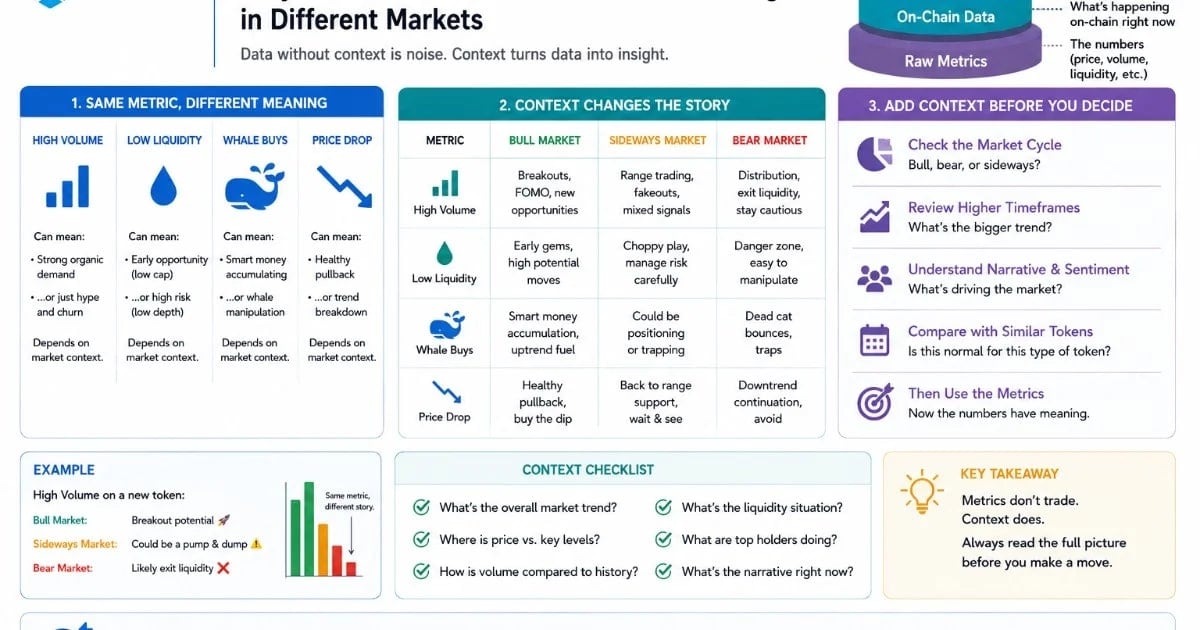
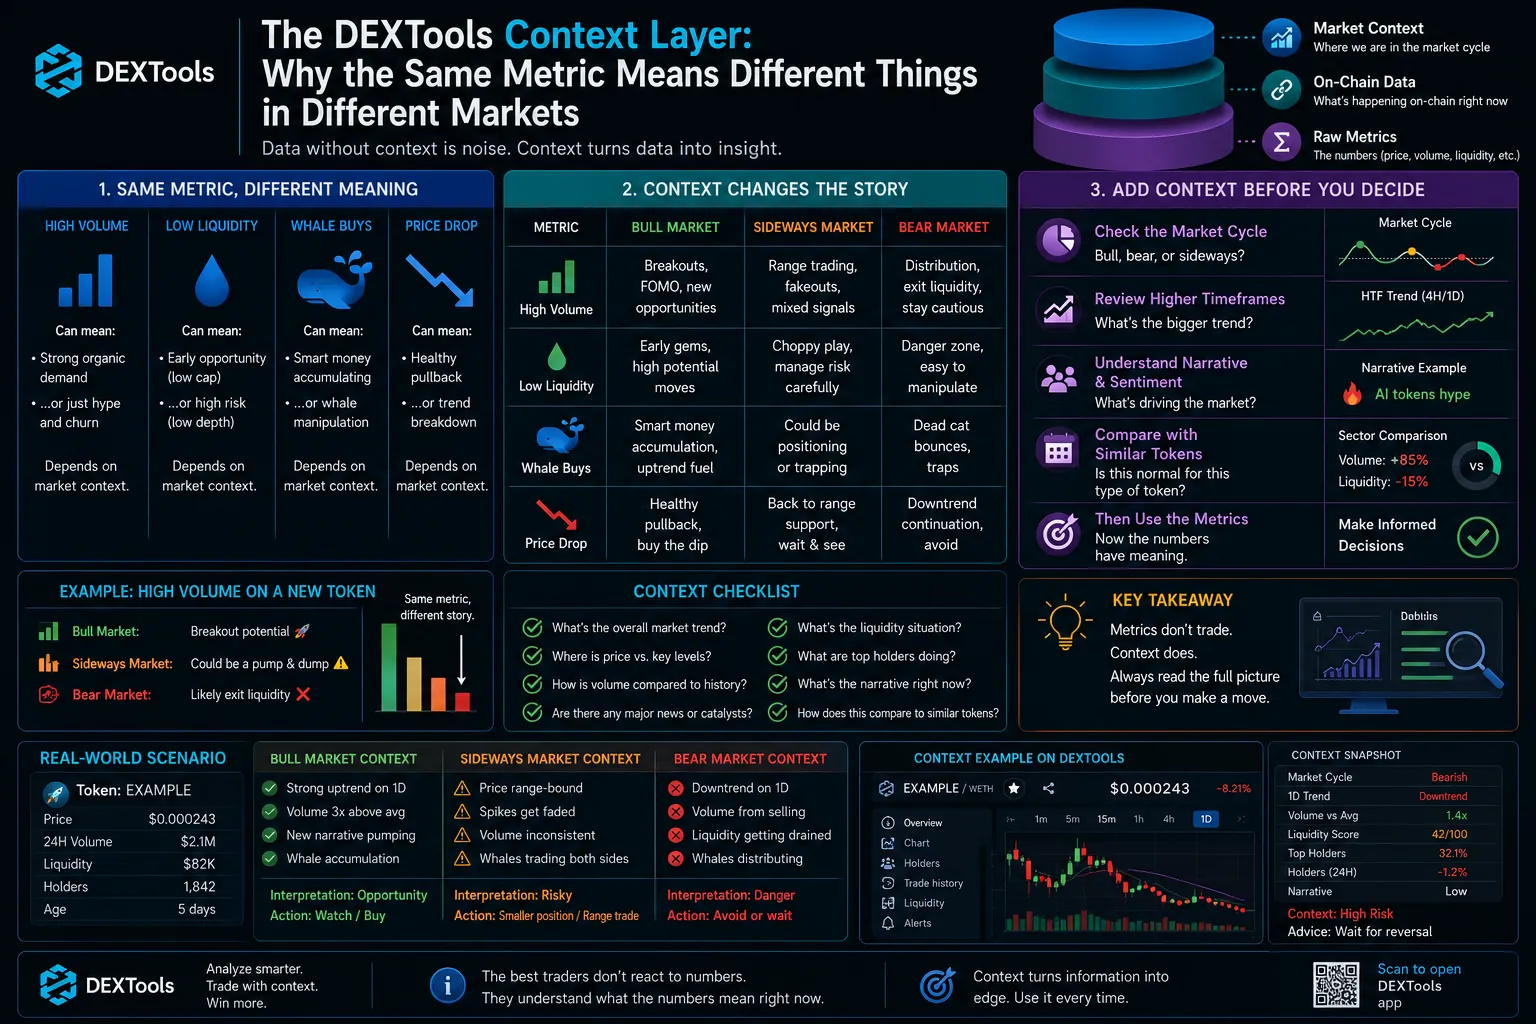
A metric does not mean the same thing in every situation.
High volume can be strong in one context and risky in another. Low liquidity can be normal for a brand new pair and dangerous for a larger token. Holder growth can show real adoption or late retail entry.
This is why traders need the DEXTools Context Layer.
The context layer helps traders interpret data based on the market environment, token age, liquidity depth, narrative, and chart structure.
What Is the Context Layer?
The context layer is the background that gives meaning to metrics.
It includes:
Token age.
Chain environment.
Liquidity size.
Narrative strength.
Without context, metrics can be misleading.
Example 1: High Volume
High volume can mean strong demand. It can also mean heavy selling, short term speculation, or low quality activity.
Ask:
Is volume supported by liquidity?
Are buyers or sellers driving it?
Is volume consistent?
Is volume normal for this token’s age?
Is volume connected to a clear narrative?
The same volume number can tell different stories depending on context.
Example 2: Low Liquidity
Low liquidity is not always interpreted the same way.
For a brand new pair, low liquidity may be expected. For an older token with high attention, low liquidity may be a warning sign.
Ask:
How old is the pair?
How much volume is trading against this liquidity?
Has liquidity improved or declined?
Can traders exit safely?
Liquidity only makes sense when compared to activity and token stage.
Example 3: Rising Holders
Rising holders can look positive, but context matters.
Ask:
Are holders growing before or after the pump?
Are top wallets selling?
Are new holders buying meaningful amounts?
Is distribution improving?
Holder growth is stronger when it appears with healthy activity and stable liquidity.
Example 4: A Clean Chart
A clean chart can show strength, but it can also hide weak foundations.
Ask:
Is volume confirming the move?
Is liquidity deep enough?
Are transactions healthy?
Are holders distributed well?
Is the chart early or already late?
Chart structure is useful only when supported by other data.
Market Conditions Matter
A metric can behave differently in different market environments.
In a strong market, buyers may support pullbacks more aggressively. In a weak market, the same setup may fail faster. During narrative rotations, attention can move quickly from one token to another.
Ask:
Is the broader market risk on or risk off?
Is the narrative active?
Are similar tokens moving?
Is liquidity rotating elsewhere?
Context helps prevent overreading isolated metrics.
The Context First Rule
Use this rule:
“Before judging a metric, define the context.”
This means you should not ask only, “Is volume high?” Ask, “Is this volume meaningful for this token, at this stage, in this market?”
That question produces better analysis.
Final Thoughts
DEXTools gives traders powerful metrics, but metrics need context. The same number can be bullish, bearish, or irrelevant depending on the situation.
The DEXTools Context Layer helps traders interpret data more accurately.
Good analysis is not just reading numbers. It is understanding where those numbers live.
Fake Volume vs Real Demand: How to Spot Artificial Momentum in DeFi Trading Liquidity to Market Cap Ratio: Spotting Risky Tokens High Volume, Low Conviction: Detecting Inflated DEX Activity Metric Double Counting: Why Volume, Transactions and Holders Can Tell the Same Story Twice