The DEXTools Evidence Map: How to Connect Data Into One Clear Thesis
— By Whatsertrade in Tutorials
Learn how to build a DEXTools evidence map and connect liquidity, volume, transactions, holders, charts, and risk into one clear trading thesis.
DEXTools gives traders many data points. Liquidity, volume, transactions, holders, charts, and risk signals all matter. But the real challenge is not finding data. The challenge is connecting it.
An evidence map helps traders turn scattered observations into one clear thesis.
Instead of saying, “This token looks good,” a trader can say, “This token is worth researching because liquidity is stable, volume is consistent, holders are growing, and the chart is consolidating after buyer interest.”
That is a stronger way to think.
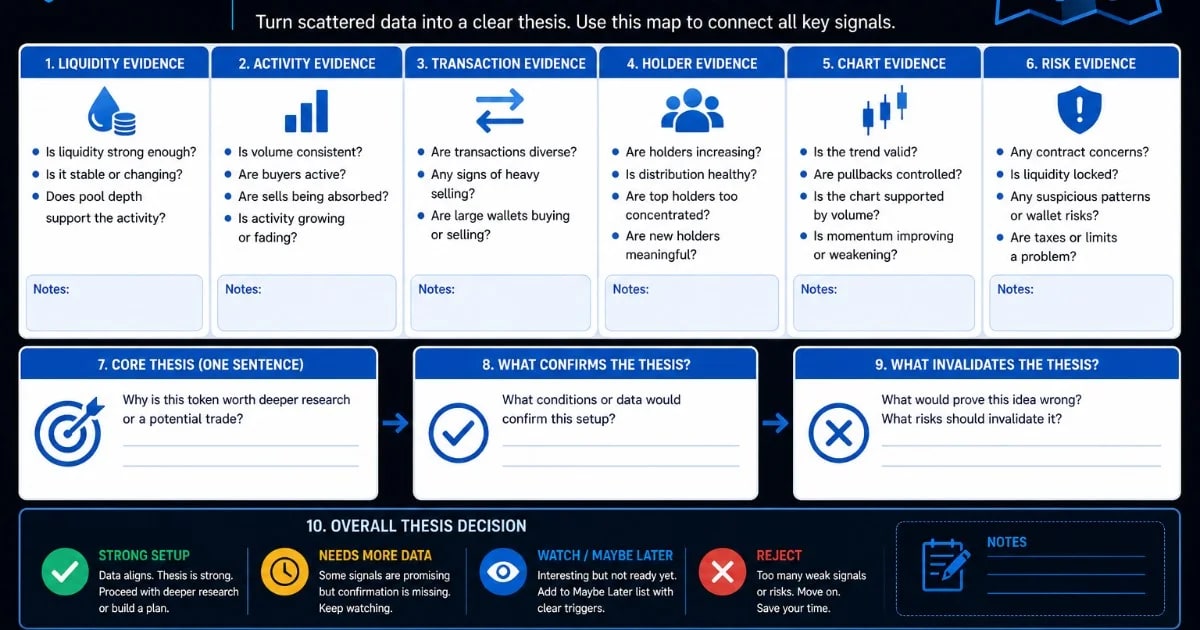
What Is an Evidence Map?
An evidence map is a structured view of the data supporting or weakening a token idea.
It organizes token research into categories and helps traders understand whether the data tells one clear story.
A good evidence map answers:
What is the opportunity?
What data supports it?
What data disagrees?
What is the main risk?
What would confirm or invalidate the thesis?
This helps traders avoid random decisions.
Step 1: Define the Core Thesis
Start with one sentence.
Example:
“This token may be worth deeper research because buyer activity is increasing while liquidity remains stable.”
The thesis should be simple, specific, and testable.
Avoid vague statements like:
“It looks bullish.”
“People are talking about it.”
“The chart looks strong.”
A strong thesis is based on observable data.
Step 2: Map Liquidity Evidence
Liquidity is the foundation of the setup.
Write what liquidity says about the token.
Examples:
Liquidity is stable.
Liquidity is growing.
Liquidity is too thin.
Liquidity does not support current volume.
Pool depth is acceptable.
The evidence map should make liquidity easy to interpret.
Step 3: Map Activity Evidence
Activity includes volume, transactions, and buy and sell behavior.
Write whether activity supports the thesis.
Ask:
Is volume consistent?
Are buyers active?
Are transactions diverse?
Are sellers dominating?
Is activity growing or fading?
Good activity evidence shows real participation, not just noise.
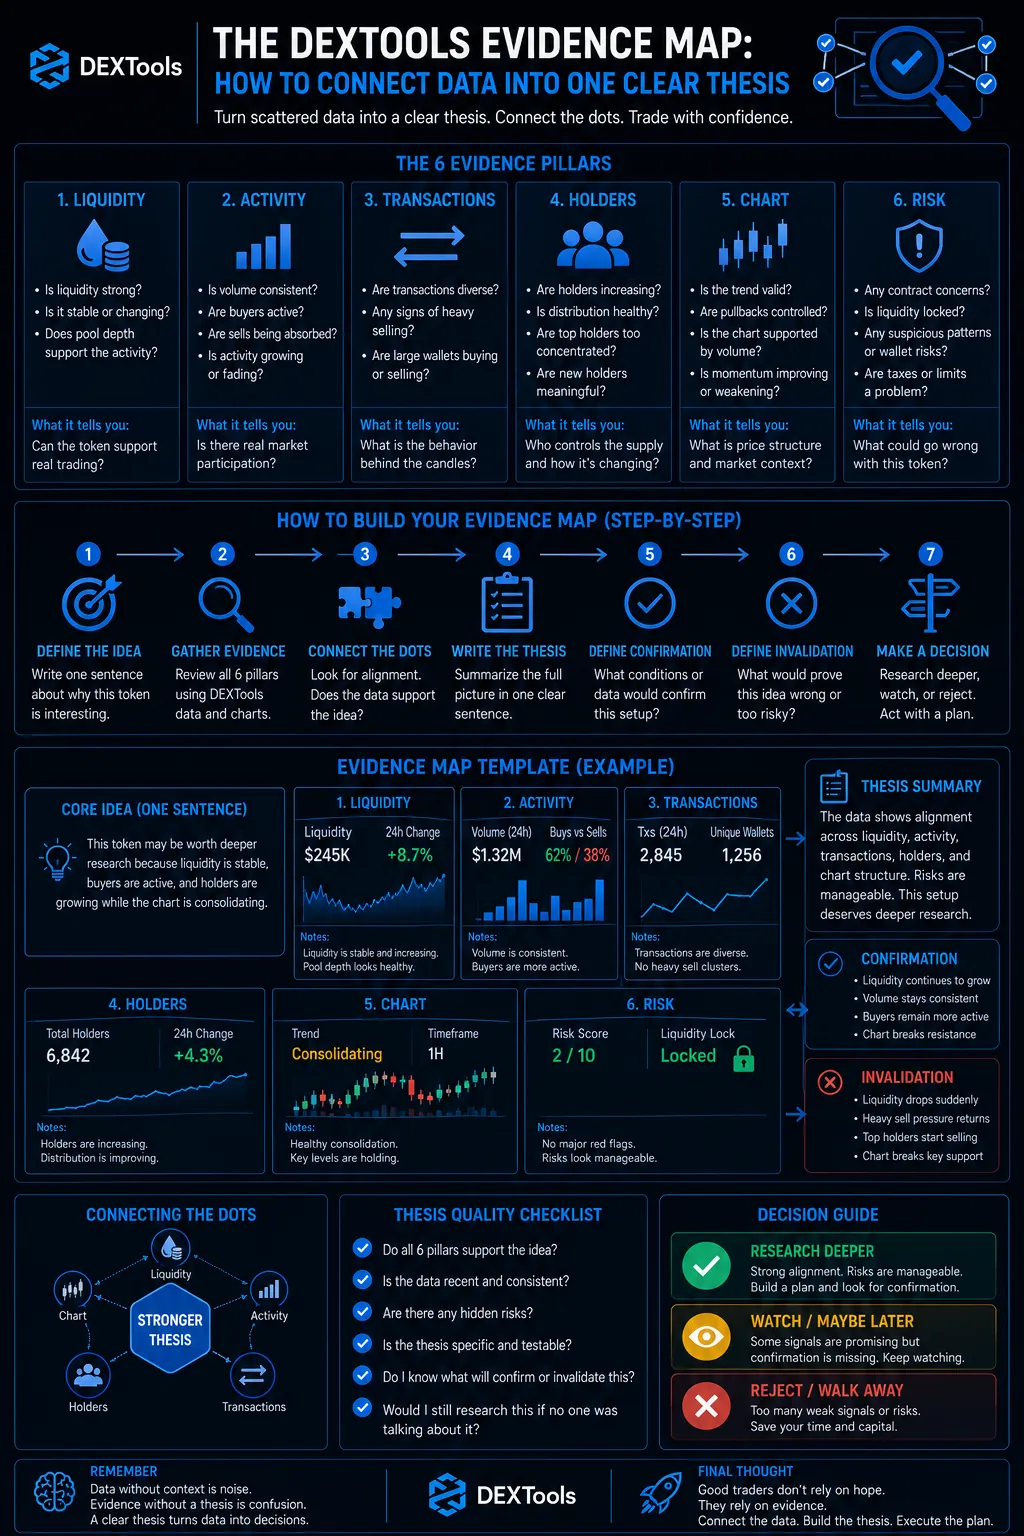
Step 4: Map Distribution Evidence
Distribution includes holders, top wallets, and large wallet behavior.
Ask:
Are holders increasing naturally?
Are top wallets too concentrated?
Are large wallets accumulating or selling?
Is participation broadening?
Distribution helps traders understand who controls the token and whether the market is becoming healthier or more fragile.
Step 5: Map Chart Evidence
The chart should confirm or challenge the thesis.
Ask:
Is the chart early or overextended?
Are pullbacks controlled?
Is price holding structure?
Is the chart supported by volume?
Is momentum improving or fading?
A chart should not be the entire thesis. It should be one layer of evidence.
Step 6: Map Risk Evidence
Risk signals help traders avoid overconfidence.
Ask:
Are there contract concerns?
Are there suspicious wallet patterns?
Is liquidity locked or unstable?
Are there unusual trading restrictions?
Are taxes or other mechanics concerning?
Risk evidence should be visible before any decision.
Step 7: Write the Final Thesis
After mapping the evidence, write a final thesis.
Example:
“This token deserves deeper research because liquidity is stable, activity is growing, holders are increasing, and the chart is consolidating. The main risk is wallet concentration, so I will wait for more distribution improvement before entering.”
This creates clarity.
Final Thoughts
The DEXTools Evidence Map helps traders connect data into one clear view. Instead of reacting to isolated metrics, traders can build a complete thesis.
A good token thesis should explain the opportunity, the evidence, the risk, and the condition for action.
DEXTools provides the data. The evidence map turns that data into better decisions.
When DEXTools Signals Disagree: How to Make Sense of Conflicting Token Data The Liquidity Decay Curve: How Token Markets Lose Depth Before They Lose Price Metric Double Counting: Why Volume, Transactions and Holders Can Tell the Same Story Twice Fake Holders vs Real Buyers: How Wallet Count Can Mislead Traders